PROVIDE Project Technical Paper 2005:1
February 2005
Figure 2: Comparing patterns of expenditure from IES 2000 and SUT 2000
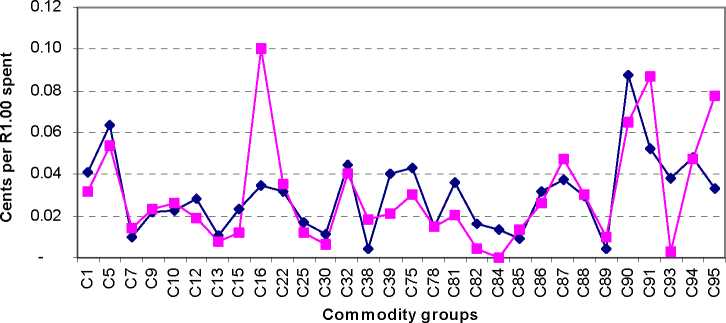
-→-IES 2000 (weighted) -≡-SUT 2000
Note: Analytic weights assumed (variable weight)
The IES 2000 income and expenditure patterns can also be compared with the National
Accounts for 2000 estimates published by the South African Reserve Bank (SARB 2000).
The 2000 data (current prices) in the September 2002 bulletin is used in this analysis (SARB,
2002). The SARB uses a more aggregated commodity grouping to report final consumption
expenditure by households. The ten commodity groups are listed in Table 4. The 95
commodity classes in the IES 2000 and SUT 2000 are mapped to these ten commodity
groups.19 Once mapped, the IES/SUT 2000 expenditure patterns can be compared to those
reported by the SARB 2000. The comparison is shown in Table 4 and graphically in Figure 3.
Table 4: Comparing patterns of expenditure from IES 2000, SUT 2000 and SARB 2000
|
Group |
Description___________________________________________________ |
_____Cents per R1.00 spent_____ | ||
|
SARB |
IES2000 |
SUT 2000 | ||
|
Group A |
Food, beverages and tobacco |
0.30 |
0.28 |
0.31 |
|
Group B |
Clothing and footwear |
0.05 |
0.06 |
0.06 |
|
Group C |
Housing, water & electricity, other fuels |
0.12 |
0.15 |
0.14 |
|
Group D |
Furnishings, household equipment and routine maintenance |
0.09 |
0.10 |
0.07 |
|
Group E |
Health |
0.07 |
0.09 |
0.11 |
|
Group F |
Transport |
0.16 |
0.09 |
0.08 |
|
Group G |
Recreation, entertainment and culture |
0.05 |
0.03 |
0.08 |
|
Group H |
Education |
0.02 |
0.04 |
0.00 |
|
Group I |
Hotels, cafes and restaurants |
0.03 |
0.03 |
0.03 |
|
Group J |
Miscellaneous and services_____________________________________ |
0.12 |
0.14 |
0.12 |
|
Total_____________________________________________________________ |
1.00 |
1.00 |
1.00 | |
Note: Analytic weights assumed (variable weight)
19 The mapping file is available from the author on request.
19
© PROVIDE Project
More intriguing information
1. Trade Openness and Volatility2. Konjunkturprognostiker unter Panik: Kommentar
3. The effect of globalisation on industrial districts in Italy: evidence from the footwear sector
4. TINKERING WITH VALUATION ESTIMATES: IS THERE A FUTURE FOR WILLINGNESS TO ACCEPT MEASURES?
5. The name is absent
6. Rural-Urban Economic Disparities among China’s Elderly
7. The name is absent
8. Regional science policy and the growth of knowledge megacentres in bioscience clusters
9. Declining Discount Rates: Evidence from the UK
10. Regional dynamics in mountain areas and the need for integrated policies