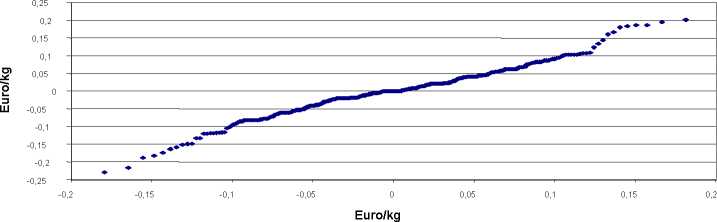
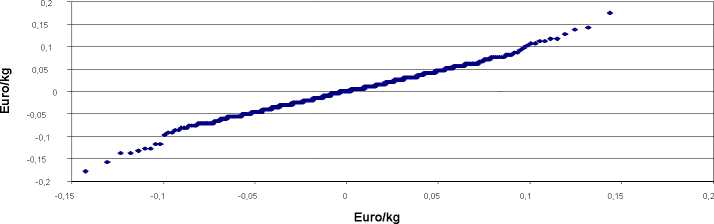
Figure 2: QQ-plots for farrows, hogs, finishing margin (1 week)
a) farrow prices (1-week-differences)
b) hog prices (1-week-differences)
c) hog finishing margin (1-week-differences)
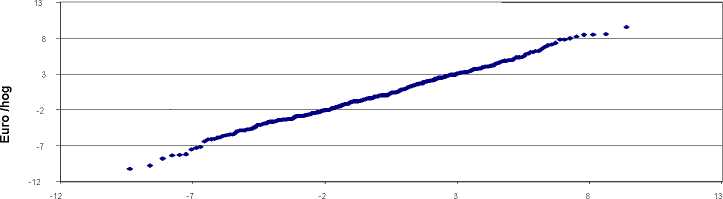
Euro/hog
Figure 2 indicates a positive excess for the weekly changes of farrow prices and hog prices whereas the
interpretation of the QQ-plot of the feeding margin is less clear. The realization of a Kolmogorov-Smirnoff
goodness of fit test supports the conjecture that the analyzed series are not normally distributed. The null hypothesis
is rejected on a 5% level for all three distributions. Finally, the Jarque-Bera-test, which summarizes deviations from
the normal distribution with respect to skewness and kurtosis, provides further evidence about the non-normality of
the distribution. The critical value of the test statistic is 9.2 on a 1% level of significance and is exceeded by the
corresponding empirical values of the farrow prices (55.4), the pig prices (55.1) and the feeding margin (23.5). Thus
the test results provide evidence that all distributions are fat tailed and justify to estimate an extreme value
distribution.
13
More intriguing information
1. The name is absent2. WP 92 - An overview of women's work and employment in Azerbaijan
3. PROFITABILITY OF ALFALFA HAY STORAGE USING PROBABILITIES: AN EXTENSION APPROACH
4. LABOR POLICY AND THE OVER-ALL ECONOMY
5. The name is absent
6. The name is absent
7. Dual Inflation Under the Currency Board: The Challenges of Bulgarian EU Accession
8. Smith and Rawls Share a Room
9. The Impact of Financial Openness on Economic Integration: Evidence from the Europe and the Cis
10. Restructuring of industrial economies in countries in transition: Experience of Ukraine