Application of the estimation procedure presented in section 3.2 is straightforward in principle, but the treatment of
the hog finishing margin deserves a further comment. Two stochastic variables, the hog prices and the farrow prices,
are involved in this case and the question arises, how the EVT, which is designed for the estimation of univariate
distributions, can be adapted. Danielsson and De Vries (2000) describe two different approaches to apply EVT to a
portfolio, namely post fitting and presampling. Post fitting is similar to Historical simulation insofar as the returns of
the different portfolio components are aggregated to give an univariate series of portfolio returns to which EVT can
be applied. Correlations need not to be estimated explicitly but they are implicitly assumed to be constant.
Presampling, in contrast, is a multivariate approach. A tail estimation is carried out for each portfolio component
and samples are drawn from the fitted distributions. A vector of portfolio returns is then calculated taking into
account the sample covariance. Obviously post fitting is computationally much simpler and is preferred here.
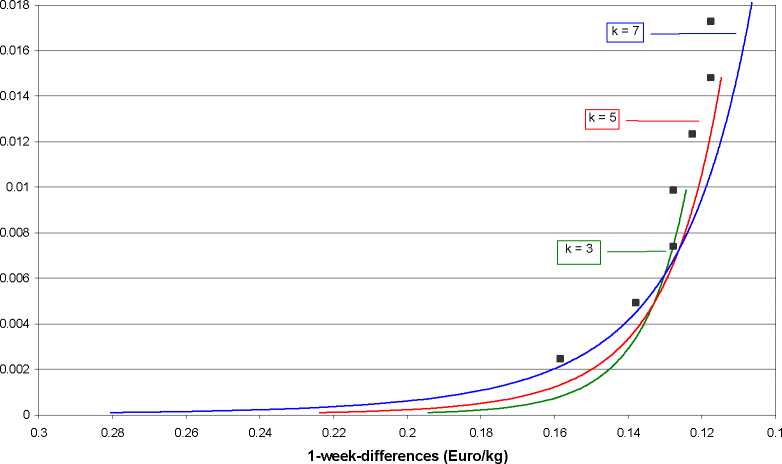
In order to motivate the aforementioned bootstrap procedure to determine the sample fraction for the tail estimation,
we present Hill-estimators based on different values of k (figure 3). Apparently the result strongly depends on the
number of extreme values which are included into the estimation. The extreme value distributions depicted in figure
4 are already based on the optimized number of extreme values. The respective figures are 6 for the farrow prices, 9
for the pig prices and 3 for the finishing margin. The results of VCM and HS are also depicted for comparative
purposes. The estimated tail indices of the extreme value distributions for the 1-week-differences of farrow prices
and pig prices are 5.37 and 4.08, respectively. Due to the positive correlation of the price changes of hogs and
farrows the fluctuations of the hog finishing margin are smaller than those of the two single series. This is reflected
by a relatively large tail index of 7.23 and corresponds also to the previous QQ-plots.
Figure 3: Tail estimators for different sample fractions (1 week)
hog prices (Euro/kg)
14
More intriguing information
1. The name is absent2. Skills, Partnerships and Tenancy in Sri Lankan Rice Farms
3. Measuring and Testing Advertising-Induced Rotation in the Demand Curve
4. The name is absent
5. Income Mobility of Owners of Small Businesses when Boundaries between Occupations are Vague
6. Subduing High Inflation in Romania. How to Better Monetary and Exchange Rate Mechanisms?
7. Dynamiques des Entreprises Agroalimentaires (EAA) du Languedoc-Roussillon : évolutions 1998-2003. Programme de recherche PSDR 2001-2006 financé par l'Inra et la Région Languedoc-Roussillon
8. RETAIL SALES: DO THEY MEAN REDUCED EXPENDITURES? GERMAN GROCERY EVIDENCE
9. Place of Work and Place of Residence: Informal Hiring Networks and Labor Market Outcomes
10. La mobilité de la main-d'œuvre en Europe : le rôle des caractéristiques individuelles et de l'hétérogénéité entre pays