in table 1 into (7) yields 1-week-volatility-forecasts. Next, the 1-week-volatility-forecasts are projected on a 12-
week-horizon: this is conducted with the square-root-rule (8) and alternatively with the Drost-Nijman-formula (9).
The results for the volatility of the hog price changes are represented in figure 1. The corresponding results for the
volatility forecasts of the farrow prices and the feeding margin look very similar (see figure A2 in the appendix).
Figure 1: Temporal aggregation of volatilities (GARCH 1,1)
hog price changes
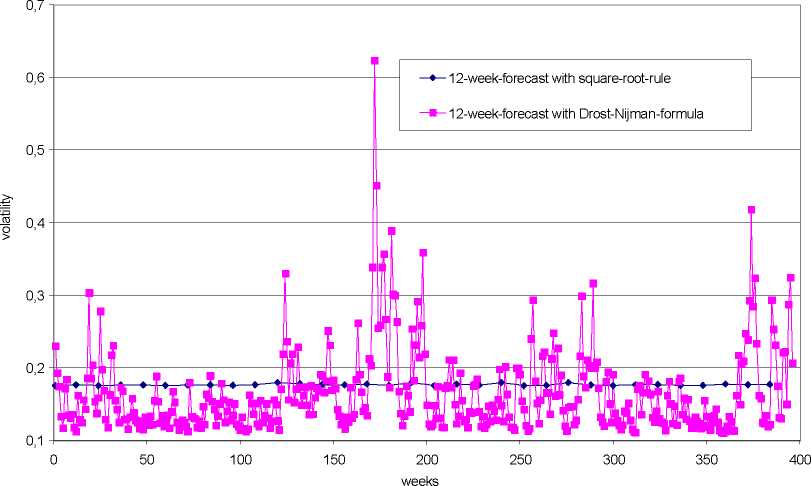
Figure 1 confirms the theoretical considerations in section 2.4. The square-root-rule cannot be regarded as a suitable
approximation for a correct time aggregation of the volatility in GARCH models. The actual fluctuations of the
volatility are substantially smaller than shown by multiplication with the factor 12~2 . That means that VaR
forecasts, that are based on this methodology, lead to a permanently overestimation and an underestimation of the
true 12-week-VaRs. The correctly determined fluctuation of the 12-week-volatility appears so small that - in
accordance with the argumentation of Danielsson and De Vries (2000) - the subsequent application of EVT is based
on unconditional distributions, regardless of the measurement of conditional heteroscedasticity in weekly price
changes.
We turn to the question whether the considered time series are fat tailed or not. At a first instance this issue can be
inspected by QQ-plots, which compare the quantiles of an empirical distribution and a theoretical reference
distribution. If the data points are approximately located on a straight line, it can be assumed that the observed data
follow the reference distribution. In figure 2 the normal distribution is chosen as a reference distribution.
12
More intriguing information
1. The name is absent2. Skill and work experience in the European knowledge economy
3. Studies on association of arbuscular mycorrhizal fungi with gluconacetobacter diazotrophicus and its effect on improvement of sorghum bicolor (L.)
4. An Interview with Thomas J. Sargent
5. The name is absent
6. Ventas callejeras y espacio público: efectos sobre el comercio de Bogotá
7. The name is absent
8. Developmental changes in the theta response system: a single sweep analysis
9. ENVIRONMENTAL POLICY: THE LEGISLATIVE AND REGULATORY AGENDA
10. Monetary Discretion, Pricing Complementarity and Dynamic Multiple Equilibria