Stata Technical Bulletin
STB-48
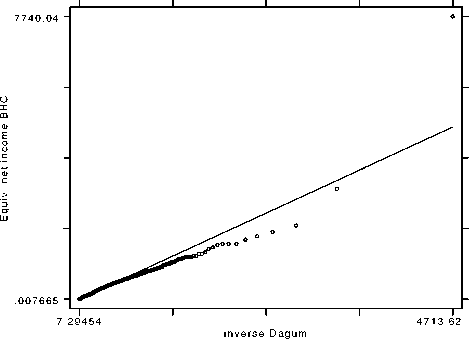
Figure 3. Output from pdagum
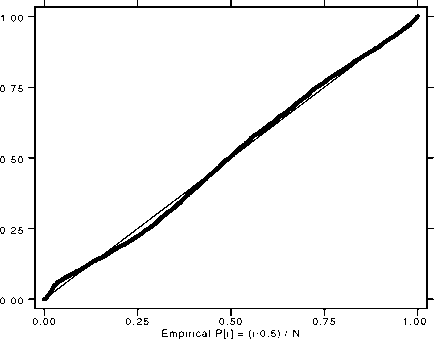
Figure 4. Output from qdagum
The plots confirm the conclusions of satisfactory goodness of fit based on other methods which were reported in the insert
on fitting Singh-Maddala and Dagum distributions (Jenkins 1999b).
References
Jenkins, S. P. 1999a. sg104: Analysis of income distributions. Stata Technical Bulletin 48: 4-18.
----. 1999b. sg106: Fitting Singh-Maddala and Dagum distributions by maximum likelihood. Stata Technical Bulletin 48: 19-25.
sg104 Analysis of income distributions
Stephen P. Jenkins, University of Essex, UK, [email protected]
This insert provides a number of programs for summarizing distributions, and income distributions in particular.
• sumdist estimates quantiles, quantile group shares, Lorenz and generalized Lorenz ordinates.
• xfrac provides a tabulation using categories defined by fractions of a cut-off value (e.g., mean or median).
• ineqdeco estimates a selection of inequality indices (including Gini, Generalized Entropy, Atkinson indices) with optional
decompositions by population subgroup into within- and between-group inequality components. ineqdecθ is a cut-down
version of this program.
• geivars provides estimates of selected Generalized Entropy inequality indices and their asymptotic sampling variances.
• ineqfac provides inequality decomposition by factor components.
• povdeco estimates three common poverty indices (the headcount ratio, averaged normalized poverty gap, and average
squared normalized poverty gap), with optional decompositions by population subgroup.
These programs supplement various other numerical and graphical tools already in Stata for analyzing income distributions.
The programs are illustrated using income distribution data for 1991 derived by Goodman and Webb (1994) from the UK
Family Expenditure Survey using the same definitions as the UK official income distribution statistics (see e.g., Department of Social
Security, 1993). The data are available from the Data Archive at the University of Essex (http://archive.essex.ac.uk).
The file used here comprises observations on 6,468 families (single persons or married couples, plus any children). A household
may contain more than one family. Define the following variables:
• ybhc is the post-tax post-transfer money income of the household to which the family belongs, in pounds per week in 1991
prices.
• eybhc is needs-adjusted post-tax post-transfer household income, i.e., ybhc divided by an equivalence scale to account for
differences in household size and composition. The scale used is the semi-official McClements one.
• wgt is an fweight used to “gross up” the estimates to represent all persons in the UK private household population.
• tenure is the housing tenure of the household in which the family lives (4 groups: social housing renter, other renter or
rent-free, owned with a mortgage, owned outright).
More intriguing information
1. Macro-regional evaluation of the Structural Funds using the HERMIN modelling framework2. Concerns for Equity and the Optimal Co-Payments for Publicly Provided Health Care
3. PERFORMANCE PREMISES FOR HUMAN RESOURCES FROM PUBLIC HEALTH ORGANIZATIONS IN ROMANIA
4. Macroeconomic Interdependence in a Two-Country DSGE Model under Diverging Interest-Rate Rules
5. EXPANDING HIGHER EDUCATION IN THE U.K: FROM ‘SYSTEM SLOWDOWN’ TO ‘SYSTEM ACCELERATION’
6. Skills, Partnerships and Tenancy in Sri Lankan Rice Farms
7. Reversal of Fortune: Macroeconomic Policy, International Finance, and Banking in Japan
8. Effects of a Sport Education Intervention on Students’ Motivational Responses in Physical Education
9. Impacts of Tourism and Fiscal Expenditure on Remote Islands in Japan: A Panel Data Analysis
10. The name is absent