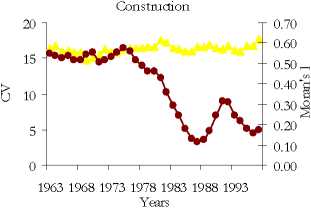
1963 1968 1973 1978 1983 1988 1993
Years
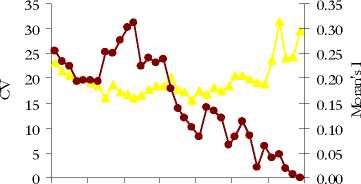
Manu Iactu ri ng
1963196819731978198319881993
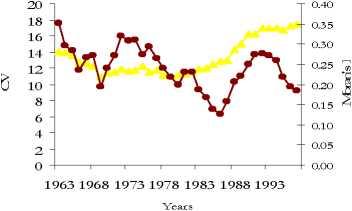
Wholesale and Retail Trade
19631968 1973 19781983 1988 1993
30 -
25 -
20 -
δ 15 -
10 -
5 -
0 -
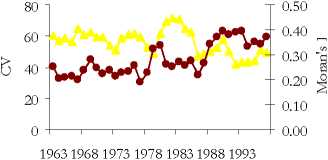
Finance Insurance and Real Estate
1963 1968 1973 1978 1983 1988 1993
Years
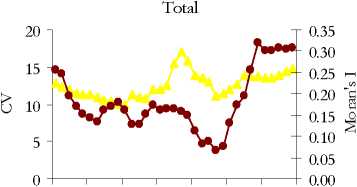
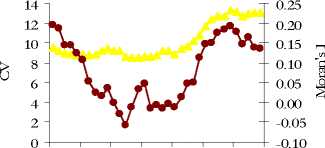
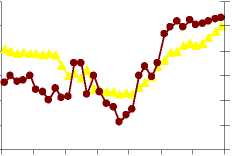
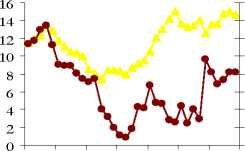
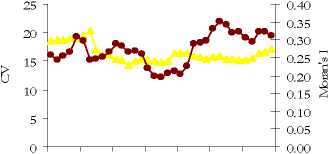
Figure 2: Coefficient of Variation and Moran’s I OfProductivity Levels, 1963—1997.
26
0.60
0.50
0.40
0.30
0.20
0.10
0.00
Transportation and Utilities
196319681973 19781983 19881993
0.30
0.25
0.20
0.15
0.10
0.05
0.00
-0.05
-0.10
1963 1968 1973 1978 1983 1988 1993
More intriguing information
1. The name is absent2. Feature type effects in semantic memory: An event related potentials study
3. Cardiac Arrhythmia and Geomagnetic Activity
4. Dynamiques des Entreprises Agroalimentaires (EAA) du Languedoc-Roussillon : évolutions 1998-2003. Programme de recherche PSDR 2001-2006 financé par l'Inra et la Région Languedoc-Roussillon
5. The name is absent
6. The East Asian banking sector—overweight?
7. The name is absent
8. The name is absent
9. The name is absent
10. On s-additive robust representation of convex risk measures for unbounded financial positions in the presence of uncertainty about the market model