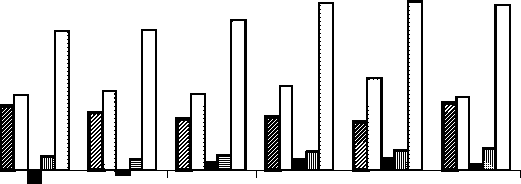
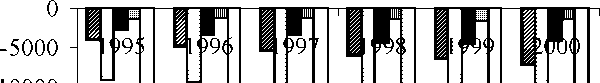
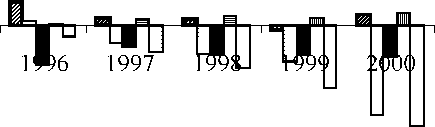
Figure 2. Balances between receipts and expenditures of the Portuguese economy and its
institutions, between 1995 and 2000
Current Balance
(saving)
25000 -∣
2 20000
£ 15000
о
1 10000
≡ 5000
-5000 j 1995 1996 1997 1998 1999 2000
Capital Balance

-10000 -
-15000 -
-20000 -
-25000 -
-30000 -
-35000 j
Total Balance
[net lending (+) / borrowing (-)]

5000
0
-5000
-10000 -

-15000 j
□ Households □ Enterprises □ Government ■ Others ■ Total
Source: Portuguese SAMs (Appendixes)
More intriguing information
1. The Challenge of Urban Regeneration in Deprived European Neighbourhoods - a Partnership Approach2. Fiscal Rules, Fiscal Institutions, and Fiscal Performance
3. ISSUES IN NONMARKET VALUATION AND POLICY APPLICATION: A RETROSPECTIVE GLANCE
4. On the Relation between Robust and Bayesian Decision Making
5. The name is absent
6. Reputations, Market Structure, and the Choice of Quality Assurance Systems in the Food Industry
7. The name is absent
8. Nonlinear Production, Abatement, Pollution and Materials Balance Reconsidered
9. Technological progress, organizational change and the size of the Human Resources Department
10. The Veblen-Gerschenkron Effect of FDI in Mezzogiorno and East Germany