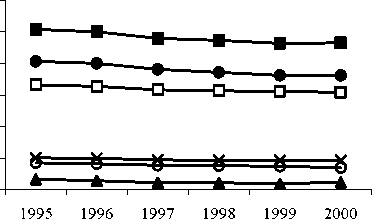
Figure 1A: Accounting multipliers and additional extragroup and intergroup components
from 1995 to 2000
Total Accounting Multipliers
(current account of households)
Total Accounting Multipliers
(capital account of households)
3,000
2,500
2,000
1,500
1,000
0,500
0,000

3,500 -∣
3,000 -
2,500 -
2,000 -
1,500 -
1,000 -
0,500 -
0,000 --
1995 1996 1997 1998 1999 2000

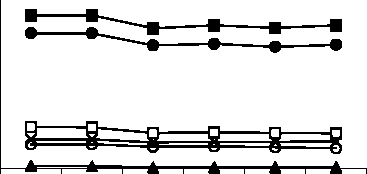
Accounting Multipliers Componentes
(current account of households)
- Aditional extragroup effects
2,500 -∣
2,000 -
1,500 -

1,000 -
0,500
0,000

1995 1996 1997 1998 1999 2000
Accounting Multipliers Componentes
(capital account of households)
- Aditional extragroup effects
3,000 -
2,500 -
2,000 -
1,500 -
1,000 -
0,500 -
0,000
1995 1996 1997 1998 1999 2000
Accounting Multipliers Componentes
(current account of households)
- Aditional intergroup effects
Accounting Multipliers Componentes
(capital account of households)
- Aditional intergroup effects
0,600 -∣
0,400 -
0,200 -
0,000 --
1995 1996 1997 1998 1999 2000

Source: Portuguese accounting multiplier
matrices (Ma) from 1995 to 2000 and
their components (additional intergroup
effects ((M2-I)*M1) and additional
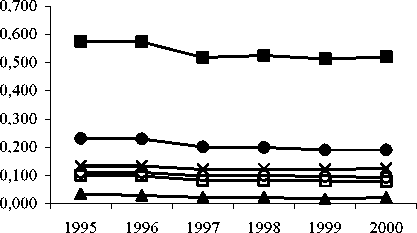
—□— Agreg.Inc.Hous. A Agreg.Inv.Hous.
X Comp.Labour O Comp.Capital
—∙—Prod.V./Tot.Cos —■—Agreg.D/S
extragroup effects ((M3-I)*M2*M1)).
- 33 -
More intriguing information
1. Technological progress, organizational change and the size of the Human Resources Department2. The name is absent
3. Innovation in commercialization of pelagic fish: the example of "Srdela Snack" Franchise
4. Evaluating Consumer Usage of Nutritional Labeling: The Influence of Socio-Economic Characteristics
5. A Classical Probabilistic Computer Model of Consciousness
6. The name is absent
7. Tobacco and Alcohol: Complements or Substitutes? - A Statistical Guinea Pig Approach
8. Reputations, Market Structure, and the Choice of Quality Assurance Systems in the Food Industry
9. Studying How E-Markets Evaluation Can Enhance Trust in Virtual Business Communities
10. The name is absent