although in this year dry land farming area is smaller than in 1994 and irrigated farming area in
1999 is clearly superior to the 1994 one.
Figure 4. Survey Agrarian Work Unit comparison with income per capita
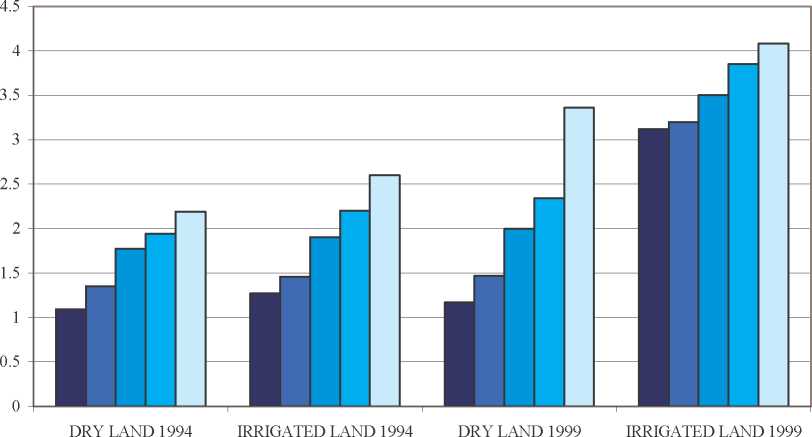
■ Survey ■ One IncomeZcapita □ Doubled IncomeZcapita □ Tripled IncomeZcapita □ Quadrupoled IncomeZcapita
4000
500 I ■
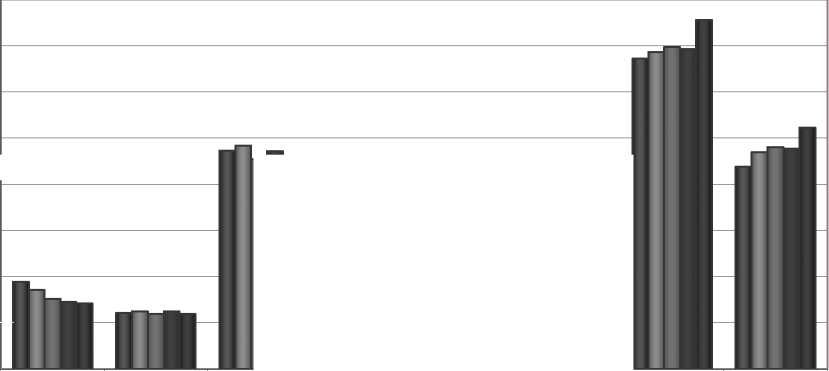
Figure 5. Survey economic variables comparison with income per capita in 1994
3500
3000
2500
2000
1500
1000
I limn
Subsidies
(EurosZHa)
Total Revenue
(EurosZHa)
Subsidies
(EurosZHa)
Total Revenue
(EurosZHa)
Direct Gross
Margin
(EurosZHa)
Direct Gross
Margin
(EurosZHa)
Total
Expenditure
(EurosZHa)
Total
Expenditure
(EurosZHa)
DRY LAND 1994
IRRIGATED LAND 1994
IO Survey □ One IncomeZcapita □ Doubled IncomeZcapita M Tripled IncomeZcapita M Quadrupoled IncomeZcapita ∣
19
More intriguing information
1. The name is absent2. The name is absent
3. Growth and Technological Leadership in US Industries: A Spatial Econometric Analysis at the State Level, 1963-1997
4. Modellgestützte Politikberatung im Naturschutz: Zur „optimalen“ Flächennutzung in der Agrarlandschaft des Biosphärenreservates „Mittlere Elbe“
5. AMINO ACIDS SEQUENCE ANALYSIS ON COLLAGEN
6. Managing Human Resources in Higher Education: The Implications of a Diversifying Workforce
7. Human Development and Regional Disparities in Iran:A Policy Model
8. Measuring and Testing Advertising-Induced Rotation in the Demand Curve
9. Change in firm population and spatial variations: The case of Turkey
10. The Institutional Determinants of Bilateral Trade Patterns