254
Table 7.4.9: Mean s∞res and Standard Deviation of teachers’ perceptions of the extent
to which they praise their pupils in mathematics classes
f-th____I _ ɪ___L
|
5ιn grade teachers |
8m grade teachers | |||||
|
N____ |
M___ |
SD |
N |
M___ |
SD | |
|
Better results than others |
47 |
2.11 |
1.03 |
42 |
2.43 |
1.19 |
|
Improvement results than before |
”47 |
3.09 |
Т2Ї |
”42 |
3.60 |
ТЇ5 |
|
More effort than others |
^^47 |
^∑94 |
^T42 |
”42 |
3.21 |
1.41 |
|
More effort than before |
”47 |
4.49 |
.62 |
”42 |
4.14 |
.93 |
|
Repeated measure ANOVA |
F(2.193,100.863) =43.911, p<.01_________ |
F(3,123) =30.750, | ||||
Figure 7.4.3: Mean scores of pupils’ perceptions of the extent to which mathematics
teachers praise pupils (age group comparison)
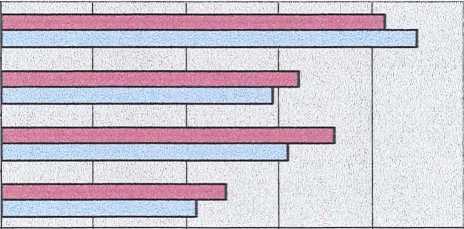
□ 8th grade
teachers
θ5th grade
teachers
0 1 2 3 4 5
I=Better results than others, 2=lmprovement results than before,
3=More effort than others, 4=More effort than before
5th grade teachers, overall, who gave result-based praise were likely to do so based on
both relative comparisons and absolute comparisons (r=. 464, p=. 001). 8th grade
teachers seemed to praise their pupils in an integrated way. There were positive
Comelations ranging from r=. 423 to r=. 671, between the various types of praise used.
The relationships between teachers’ reported frequency of adoption of praise and their
perceptions of the effects and deployment of different teaching methods were not
examined, due to the skewed distribution of responses. 10.6% of 5th grade teachers and
19.0% of 8th grade teachers replied that they always or nearly always praised pupils for
254
More intriguing information
1. AMINO ACIDS SEQUENCE ANALYSIS ON COLLAGEN2. The name is absent
3. CHANGING PRICES, CHANGING CIGARETTE CONSUMPTION
4. The name is absent
5. The name is absent
6. An institutional analysis of sasi laut in Maluku, Indonesia
7. The name is absent
8. The name is absent
9. Barriers and Limitations in the Development of Industrial Innovation in the Region
10. Education Research Gender, Education and Development - A Partially Annotated and Selective Bibliography