Investment Growth over Years and Wealth
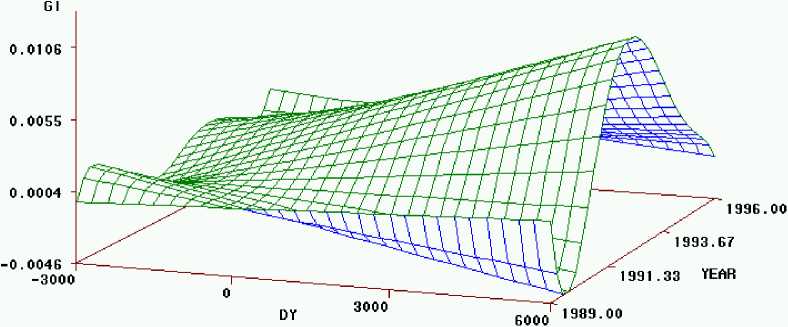
FIGURE 1. Distribution of change in investments, GI, versus YEAR and relative
income, DY.
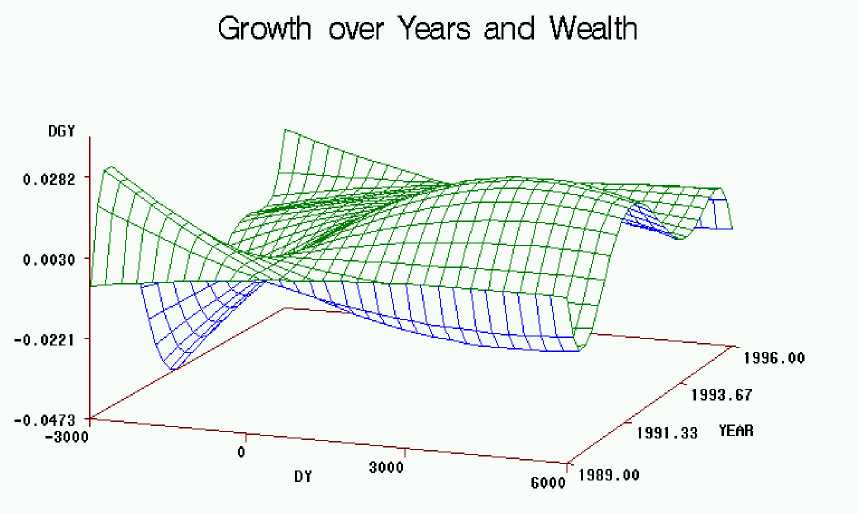
FIGURE 2. Distribution of relative growth rate, DGY, versus YEAR and level of
relative income DY, calculated by the equations (24) and (31) and using equation
(33). (Sample conditions: DSEZ = 0, GI1 = GI2, DY2 = 0)..
Figure 2 shows converging growth at the start and end of the period and diverging
growth in the middle that is 1992-1994.
14
More intriguing information
1. The name is absent2. The Values and Character Dispositions of 14-16 Year Olds in the Hodge Hill Constituency
3. Altruism with Social Roots: An Emerging Literature
4. The name is absent
5. Motivations, Values and Emotions: Three Sides of the same Coin
6. The Institutional Determinants of Bilateral Trade Patterns
7. The Functions of Postpartum Depression
8. Fiscal Insurance and Debt Management in OECD Economies
9. The name is absent
10. The name is absent