G-DAE Working Paper No. 03-01: “Read My Lips: More New Tax Cuts”
Appendix 1. Gini Coefficients
The Gini coefficient is a common metric used by economists to measure the degree of
inequality in the distribution of income or wealth. To illustrate the steps necessary to
calculate a Gini coefficient, consider its application to the distribution of income across
households. First, arrange all households from lowest income to highest. Then add up
the total income of all households. Next, calculate the cumulative percentage of income
belonging to each group of ordered households. For example, in the U.S. the bottom
20% of households received 3.5% of income in 2001.22 The second quintile received
8.8% of income, so the cumulative share of income to the bottom 40 percentiles of
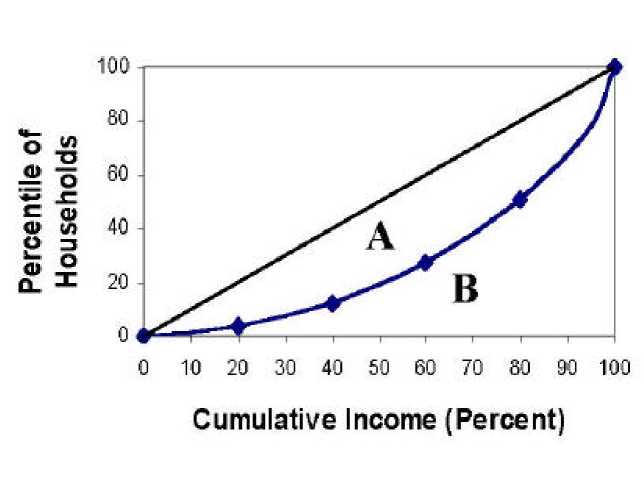
households is 12.3%. Plot this relationship as shown in Figure A1. The curve shown in
Figure 1 is referred to as a Lorenz curve.
If income were equally distributed, the Lorenz curve would be the 45-degree line shown
in Figure 1. As income becomes more unevenly distributed, the Lorenz curve bows away
from the straight line. Thus, the larger area A in Figure 1, the greater the degree of
inequality. A Gini coefficient is calculated as:
Gini coefficient = Area A / (Area A + Area B)
Note that a Gini coefficient must range between zero (perfect equality) and one (one
individual or household receives everything). While other measures are used to measure
economic inequality, the Gini coefficient is the most widely used metric and has been
estimated for most countries in the world.
Figure A1. Lorenz Curve for the U.S. Distribution of Income
22 Money Income in the United States: 2001, U.S. Census Bureau report P60-218, September 2002.
14
More intriguing information
1. Robust Econometrics2. ENERGY-RELATED INPUT DEMAND BY CROP PRODUCERS
3. The name is absent
4. Evaluating the Success of the School Commodity Food Program
5. El Mercosur y la integración económica global
6. The name is absent
7. The name is absent
8. Natural Resources: Curse or Blessing?
9. A Unified Model For Developmental Robotics
10. The name is absent