Figure 2: Adjusted Cohen Mansfield Agitation Inventory score by treatment
group and time (higher scores indicate greater agitation)
CMAI
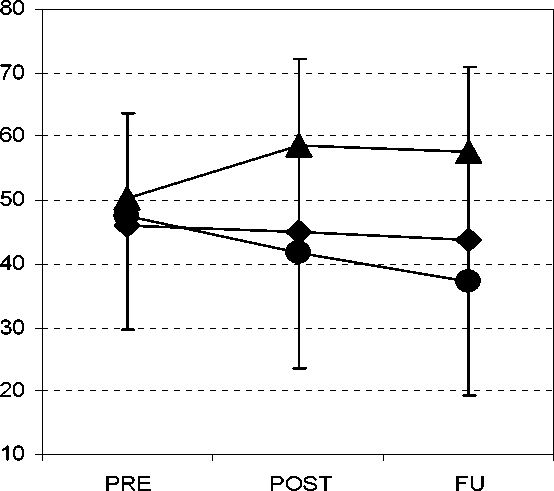
—♦— DCM
—•— PCC
—UC UC
Table 2: Annual Pharmaceutical Costs Per Resident
|
Mean, standard |
DCM |
PCC |
UC |
Total | |
|
Period |
Pre- Intervention |
598.44 (906.30) |
647.35 (790.39) |
473.25 (905.64) |
579.51 (868.34) |
|
Post- Intervention |
617.72 (955.06) |
597.89 (852.35) |
363.00 (852.75) |
541.45 (897.13) | |
|
Follow-up |
542.21 (883.32) |
560.49 (823.68) |
398.19 (871.16) |
508.10 (860.10) | |
|
Total |
587.31 (913.29) |
605.37 (818.91) |
414.96 (875.68) |
545.55 (874.88) | |
Pair-wise t-tests were run on this information, investigating whether the
pharmaceutical costs per person at a time point were statistically significantly
different from the observed mean. In the nine pair-wise comparisons, none were
statistically significant at the 5% level. Therefore, as the mean difference between
More intriguing information
1. The Shepherd Sinfonia2. The name is absent
3. Opciones de política económica en el Perú 2011-2015
4. Centre for Longitudinal Studies
5. The name is absent
6. The Impact of Individual Investment Behavior for Retirement Welfare: Evidence from the United States and Germany
7. O funcionalismo de Sellars: uma pesquisa histδrica
8. The name is absent
9. Does Competition Increase Economic Efficiency in Swedish County Councils?
10. Bridging Micro- and Macro-Analyses of the EU Sugar Program: Methods and Insights