|
Combined RewardNovelty Reward Q-Value Illl ->. O -ʌ M θɔ —4- O -ʌ M θɔ —4- O -ʌ M OO O -ʌ M Z ⅛ ____________________ Z ⅛ ____________________ Z ⅛ ____________________ Z ⅛ ____________________ |
^ ______ |
--- Stay -- - Left Right | |
|
)_______100 200 300 400 |
500 600 | ||
|
_ . . . . .. . -------- — _ _ |
• Stay ■ Left ■ | ||
|
) 100 200 300 400 |
500 600 | ||
|
- ∙∙ ∙ ∙ ∙ ⅜ ∙ ∙ ζ .* , .∙ ∙ V Д |
■ Stay ■ Left ■ | ||
|
)_______100 200 300 400 |
500 600 | ||
|
. ∙ ∙ : . .: ∙.∙λ .....∙.- ” t∙ |
■ Stay ■ Left ■ | ||
|
1 100 200 300 400 Time |
500 600 | ||
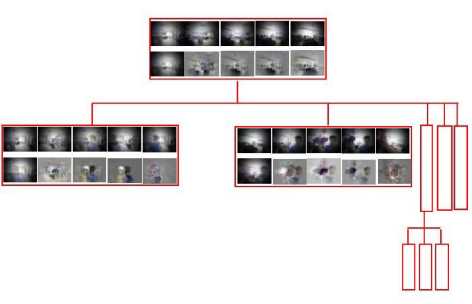
Figure 12: Tree Structure. Each block indicates a tree
node. The first row of each node shows the x-cluster
centers presented as images. The first image of the sec-
ond row is the grand mean of all the х-clusters. The
remaining images of the second row are the discriminat-
ing features represented as images. Here a Gaussian filter
is used to alleviate noise.
Figure 9: Tlie Q-value, reward, novelty and integrated
reward of each action at position -2.

Figure 10: Preference to certain visual stimuli.
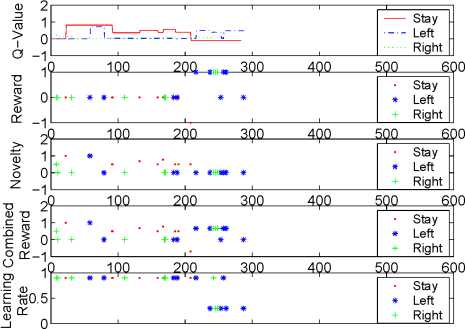
5.2 Multiple rewards for different actions
In this experiment, we gave different rewards to each
action at position 2. In the beginning (first 200
steps), we kept moving a toy, so the Q-valne of ac-
tion 0 (stay) is the highest one (the first plot in Fig.
13). The value of novelty is shown in the third plot.
Then punishment was issued to action 0 at step 205.
Its Q-value became negative. Positive rewards were
issued to action 1 and 2 (the second plot). Action 1
got more positive rewards, finally its Q-value became
the largest. The fifth plot shows the changes of learn-
ing rate. The initial learning rate is 0.9. If rewards
are issued, the learning rate decreases (around 0.3),
which means that the robot would remember rewards
much longer than novelty.
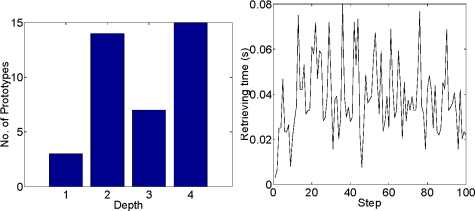
No. of prototypes in each level Retrieving time
Figure 11: Real time testing information.
0
100 200 300 400 500 600
Time
Figure 13: The Q-value, reward, novelty, integrated re-
ward and learning rate of each action at position 2 when
multiple rewards are issued.
More intriguing information
1. Social Balance Theory2. THE MEXICAN HOG INDUSTRY: MOVING BEYOND 2003
3. Surveying the welfare state: challenges, policy development and causes of resilience
4. Consumption Behaviour in Zambia: The Link to Poverty Alleviation?
5. Cultural Diversity and Human Rights: a propos of a minority educational reform
6. Moi individuel et moi cosmique Dans la pensee de Romain Rolland
7. The name is absent
8. The name is absent
9. The name is absent
10. The name is absent