SIZE OF HIPPOCAMPAL PYRAMIDAL NEURONS IN SCHIZOPHRENIA
Table 1 Preparation and donor characteristics of the brain samples used in this study
|
Control |
Schizophrenia | |||
|
Female |
Male |
Female |
Male | |
|
(n¼7) |
(n¼9) |
(n¼5) |
(n¼8) | |
|
Age (years):1 mean (s.d.) |
62.71 (9.88) |
58.78 (12.0 1) |
61.20 (13.95) |
62.75 (10.00) |
|
Death to post-mortem interval (h):2 |
52.5 (29.7) |
37.0 (28.3) |
59.0 (43.7) |
58.9 (37.9) |
|
mean (s.d.) Duration in formalin (years):3 mean (s.d.) Hospital of origin4 (n) |
1.86 (1.46) |
2.56 (1.24) |
4.40 (2.07) |
3.75 (1.49) |
|
Belfast |
0 |
0 |
2 |
2 |
|
Oxford |
5 |
7 |
1 |
2 |
|
Runwell |
2 |
2 |
2 |
4 |
|
Neuroleptic drug prescription5 |
N/A |
N/A | ||
|
Little |
2 |
0 | ||
|
Average |
1 |
2 | ||
|
Much |
2 |
6 | ||
|
Duration of illness (years):6 mean (s.d.) |
N/A |
N/A |
31.20 (8.87) |
30.75 (14.44) |
ANOVA, analysis of variance; N/A, not applicable.
1. No intergroup differences (by ANOVA, all F(1,25)40.40, P50.531).
2. No intergroup differences (by ANOVA, all F(1,25)41.12, P50.300).
3. Patients longer than controls (by ANOVA, F(1,25)¼10.44, P¼0.003); no gender difference or gender6diagnosis in-
teraction (both F(1,25)41.36, P50.255).
4. No intergroup differences (w2¼10.28, d.f.¼6, P¼0.114).
5. No gender difference in patients (w2¼3.85, d.f.¼2, P¼0.146).
6. No gender difference in patients (by ANOVA, F(1,11)50.005, P¼0.952).
the entirety of the subfield (Fig. 1). The
search pattern was 0.560.5 mm2 for the
hilus and CA2/3 subfields, 161 mm2 for
the CA1 subfield, and 0.7560.75 mm2 for
the subiculum. Each subfield appeared on
an average of 6.7 slides per case (range
3-15; in a few cases the hippocampus was
cut obliquely, which meant it appeared in
few sections, although this did not alter
the intensity of the sampling). Neuron
density (Nv) was counted in a mean 57
dissectors and volume density (Vv) was as-
sessed with a mean 88 frames per case; a
mean of 89 neurons were counted for Nv,
and a mean of 135 points were counted
for Vv estimation per case. At each such
point a plane within the section was
brought into focus, and an array of 36
random test points thrown over the
microscope image. The number of test
points that fell over pyramidal cell bodies
was counted, and the mean number of
point counts (P) per image calculated.
Pyramidal cells were identified on the
basis of their position, orientation shape,
presence of an apical dendrite and promi-
nent, single nucleolus. The volume density
was calculated for each subfield by
Vv ¼ P=36.
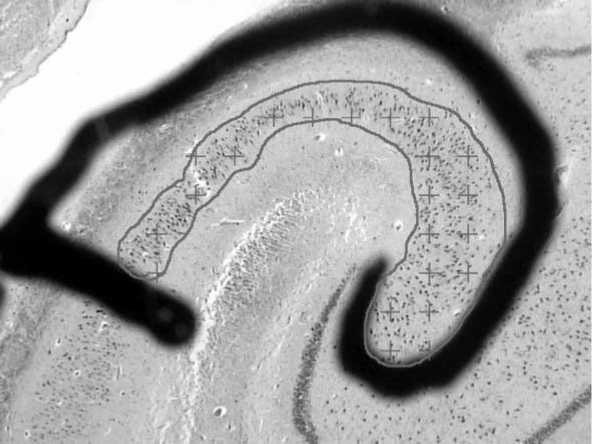
Fig. 1 Hippocampal region CA2/3 with superimposed raster sampling pattern.
In a previous study, the neuron density
(number of cells per unit volume, Nv ) with-
in each hippocampal subfield had been esti-
mated (Walker et al, 2002; further details
available from the author upon request).
Using these data, the mean pyramidal cell
body volume (VN) was calculated using
the formula VN ¼ Vv =Nv .
Statistical methods
The cell volume for each subfield was as-
sessed by repeated-measures analysis of
covariance (ANCOVA), with diagnosis
and gender as between-subject factors and
side as a within-subject factor, using SAS
version 6.12 for Macintosh. As there was
a significant difference between the brains
from the control and schizophrenia groups
in the duration spent in formalin prior to
histological preparation, this variable was
entered as a covariate in the ANCOVA
model. The main effect of diagnosis, gen-
der, and interactions of these with side,
gender, and gender and side together were
tested for. Given the number of effects
tested for each measure, a was set at 0.01.
Thus, for an effect to be significant, it had
to generate a value for P of 0.01 or below.
RESULTS
Quality of measures
The observed coefficient of error (OCE)
for the individual estimates of subfield
volume, cell density and cell number were
calculated for 10 cases in the manner de-
scribed by Gundersen & Jensen (1987)
and West & Gundersen (1990). This coef-
ficient is a measure of the variability of
measures of a specific structure across dif-
ferent slices; possible values are 0 to 1. It is
increased by irregularly shaped structures
and by inaccurate and unreliable measure-
ment. For the measures of VN, the mean
OCE values were all 40.121. For the mea-
sures of Vv, mean OCE values were all
40.061. For Nv, the mean values of
OCE were all 40.1001. The values of
415
More intriguing information
1. DISCRIMINATORY APPROACH TO AUDITORY STIMULI IN GUINEA FOWL (NUMIDA MELEAGRIS) AFTER HYPERSTRIATAL∕HIPPOCAMP- AL BRAIN DAMAGE2. Inflation and Inflation Uncertainty in the Euro Area
3. Natural hazard mitigation in Southern California
4. The name is absent
5. The name is absent
6. Income Taxation when Markets are Incomplete
7. How does an infant acquire the ability of joint attention?: A Constructive Approach
8. Density Estimation and Combination under Model Ambiguity
9. The name is absent
10. Income Mobility of Owners of Small Businesses when Boundaries between Occupations are Vague