11b-HSD1 is essential for human adipogenesis . I J BUJALSKA and others 301
Cortisone (nM)
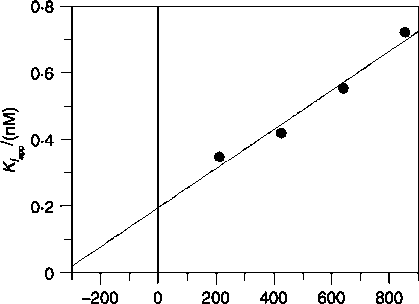
Figure 1 Effect of cortisone concentration upon the apparent
inhibition constant Kiapp of the inhibitor PF-877423: a value for
the true inhibition constant Ki (0∙2 G0.04 nM) and the Michaelis-
Menten constant Km (333.4G109.2 nM) is calculated by fitting the
experimental data using equation (2).
Characterisation of chub-S7 cells
At confluence (day 0), Chub-S7 cells did not accumulate lipid
droplets (Fig. 3A); however, they readily underwent adipogen-
esis (shown as oil red O staining) when cultured for 21 days in
chemically-defined, serum-free media (166 nM insulin, 1 mM
PPARg agonist and 1 mM F; Fig. 3B). As demonstrated
by conventional PCR, confluent undifferentiated Chub-S7
cells expressed GRa H6PDH and PPARg1 mRNA but not
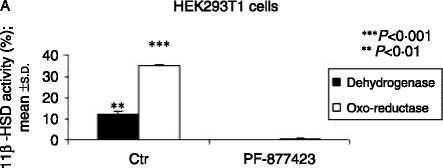
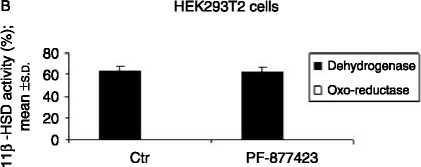
Figure 2 (A) PF-877423 inhibits 11b-HSD1 enzyme activity
(dehydrogenase: 12.4G1.0 vs 0.2G0.01, % cortisol to cortisone
conversion, and oxo-reductase: 34.7G0.6 vs 0.4G0.1, % cortisone
to cortisol conversion, meanGS.D.) as measured in HEK293T1
(HEK293 cells stably transfected with human 11b-HSD type 1
cDNA), nZ3 but not (B) 11b-HSD2 enzyme activity (63.6G4.0 vs
62.2G4.4, % cortisol to cortisone conversion, meanGS.D., control
versus PF-9Z877423 respectively) as measured in HEK293T2 (cells
stably transfected with human 11b-HSD type 2 cDNA), nZ3.
P values: **P!0.01, ***P!0.001.
11b-HSD1, PPARg2, GLUT-4, G3PD or FABP4 mRNA
(Fig. 3C). In the differentiated Chub-S7 cells, increased
expression of adipogenic markers including G3PD and
FABP4 was observed. This process resulted in an increase in
11b-HSD1, GLUT-4 and PPARg2 mRNA levels (Fig. 3D).
Across differentiation, 11b-HSD1 oxo-reductase activity
increased significantly; from nil on day 0 to 0.4G0.2 on day
3, 5.3G0.7 on day 5, 8.4G0.14 on day 7, 10.5G1.9 on day 9
and 5.9G1.9 on day 16 (pmol/mg per h, meanGS.D., nZ7, all
P!0.01 versus previous time point; Fig. 4A). Conventional
PCR findings were endorsed and quantified by real-time PCR.
Expression of 11b-HSD1 mRNA increased 2.9-fold on day 5,
3.6-fold on day 7, 3.4-fold on day 9 (P!0.01) and 38.1-fold on
day 16 (P!0.001) when compared with day 3, nZ4 (Fig. 4B).
We observed a transient increase in H6PDH mRNA levels
(11b-HSD1 co-factor provider) — 2.9-fold on day 3, 3.5-fold
on day 5, 3.7-fold on day 7, 3.4-fold on day 9 and 0.6-fold
on day 16 versus day 0, P!0.01 (Fig. 4C) — but there was no
significant change in GRa mRNA during Chub-S7
differentiation (Fig. 4D).
Significant increases in differentiation markers FABP4 (2-fold
on day 5 (P!0.01), 38-fold on day 7, 142-fold on day 9 and
870-fold on day 16 versus day 3, P!0.001) and G3PD (4.5-fold
on day 7 (P!0.01), 22-fold on day 9 and 380-fold on day 16
versus day 5, P!0.001) were also observed (Fig. 5A and B
respectively). When compared with day 7, the expression of
adipocyte-specific genes including GLUT-4 and PPARg2 also
increased — 24-fold on day 9 and 9.8-fold on day 16, P!0.01
(GLUT-4) and 1.3-fold on day 7 and 2.2-fold on day 16,
P!0.01 (PPARg2; Fig. 5C andD respectively).
Glucocorticoid metabolism and adipogenesis in Chub-S7 cells
incubated with PF-877423
Chub-S7 cells differentiated for 10 days with 500 nM
cortisone showed increased 11b-HSD1 oxo-reductase
activity: 14.6G2.3 (E) versus 3.4G1.3 (control), pmol/mg
per h meanGS.E.M., P!0.001 (Fig. 6A), and mRNA
expression (14.1-fold versus control; Fig. 6B). Co-incubation
with 100 nM PF-877423 abolished this effect: 14.6G2.3 (E)
versus 1.3G1.1 (ECPF-877423) vs 0.6G0.5 (PF-877423)
pmol/mg per h, meanGS.E.M. (Fig. 6A) and 14.1-fold (E)
versus 1.2-fold (ECPF-877423), 11b-HSD1 activity and
mRNA respectively (Fig. 6B). Differentiated Chub-S7 cells
with E showed increased expression of the adipogenic
markers FABP4 (312-fold versus control, P!0.001) and
G3PD (47-fold versus control, P!0.001) — an effect that was
completely abolished by co-incubation with PF-877423 (1.3-
and 0.7-fold, FABP4 and G3PD respectively; Fig. 6C and D).
The change in adipogenesis following incubation with the
11b-HSD1-specific inhibitor was confirmed visually through
staining the cells with oil red O after 21 days of differentiation.
A marked increase in the number of red-stained cells was
observed in cells differentiated with E or F but not in the
presence of PF-877423 (Fig. 6E).
www.endocrinology-journals.org
Journal of Endocrinology (2008) 197, 297-307
More intriguing information
1. Endogenous Heterogeneity in Strategic Models: Symmetry-breaking via Strategic Substitutes and Nonconcavities2. KNOWLEDGE EVOLUTION
3. Environmental Regulation, Market Power and Price Discrimination in the Agricultural Chemical Industry
4. Forecasting Financial Crises and Contagion in Asia using Dynamic Factor Analysis
5. NATURAL RESOURCE SUPPLY CONSTRAINTS AND REGIONAL ECONOMIC ANALYSIS: A COMPUTABLE GENERAL EQUILIBRIUM APPROACH
6. Evaluating the Impact of Health Programmes
7. Female Empowerment: Impact of a Commitment Savings Product in the Philippines
8. The name is absent
9. WP 1 - The first part-time economy in the world. Does it work?
10. Spatial agglomeration and business groups: new evidence from Italian industrial districts