58
A, Tactile. B. Auditory
CVisual
hts-5it^ ^v
D. IndividualTac ∩ Aud ∩ Vis
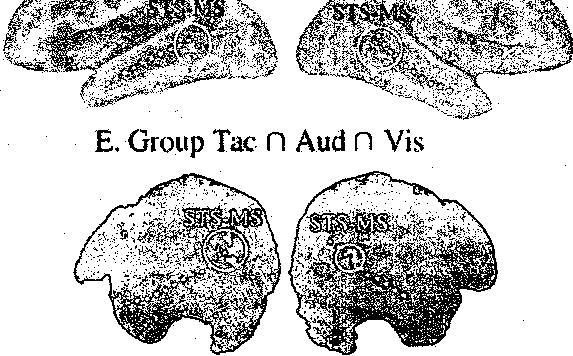
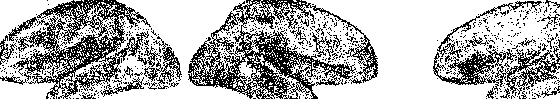
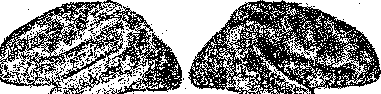
Figure 3. Brain areas responding to auditory, visual and tactile stimulation in Experiment 2. A.
Lateral view of a single subject's partially inflated right hemisphere. Colored regions responded
Significantly to tactile stimulation. Active regions in posterior STS are colored yellow, other active
regions are colored purple. The fundus of the STS is shown as a white dashed line. B. Single subject
activation to auditory stimulation. C. Single subject activation to visual stimulation. D. Single subject
conjunction map showing voxels responding to all three modalities. Circled yellow cluster shows the
STS multisensory area, STSms. E. Mixed effects group map (n=8). Voxels showing a significant
response to all three modalities. Yellow cluster shows the STSms, with center-of-mass (-44, 35,13)
in left hemisphere and (56,41,14) in right hemisphere.
The event-related design used for the tactile experiment allowed us to extract
the average hemodynamic responses to single stimulation trials (Fig. 4A). The strongest
response was to contralateral hand stimulation (0.25%), which was significantly greater
than the response to ipsilateral hand stimulation (0.18%, paired t-test with 7 degrees of
More intriguing information
1. Fiscal Insurance and Debt Management in OECD Economies2. What Drives the Productive Efficiency of a Firm?: The Importance of Industry, Location, R&D, and Size
3. The name is absent
4. Tissue Tracking Imaging for Identifying the Origin of Idiopathic Ventricular Arrhythmias: A New Role of Cardiac Ultrasound in Electrophysiology
5. LIMITS OF PUBLIC POLICY EDUCATION
6. Ongoing Emergence: A Core Concept in Epigenetic Robotics
7. The name is absent
8. The name is absent
9. The name is absent
10. The name is absent