90


——
О 0.2 0.4 0.6 0.8 1
Coincidence factor Γ
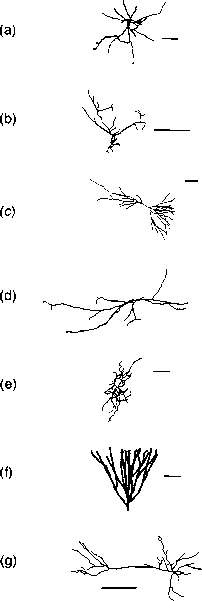
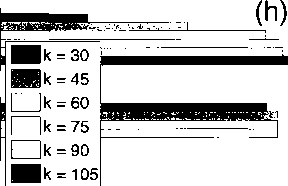
Figure 3.8: Coincidence factors Γ show spike capturing accuracy for seven different cells
using various sizes of reduced systems (fc = kυ — kf) and Algorithm 3 (see (h)). The strongly
excitable channel models are used here (see Table 3.7 for the model used on each cell). From
top to bottom the cells are: (a) projection interneuron AR-l-20-04-A (Martinez), (b) CA3
hippocampal interneuron 951005a (Chitwood et al., 1999), (с) САЗ hippocampal pyramidal
cell 12299402 (Chitwood et al., 1999), (d) CAl hippocampal interneuron 100103a from
the stratum oriens (Golding et al., 2001) (Golding et al., 2005), (e) retinal ganglion cell
mp_tb_40984_gcl (Toris et al., 1995), (f) hippocampal cell 512882 from the dentate gyrus
(Rihn and Claiborne, 1990), and (g) pyramidal cell P8-DEV66 from the cerebral cortex
(Furtak et al., 2007). Scale bars on all cells represent 100 μm.
More intriguing information
1. Learning and Endogenous Business Cycles in a Standard Growth Model2. Opciones de política económica en el Perú 2011-2015
3. Naïve Bayes vs. Decision Trees vs. Neural Networks in the Classification of Training Web Pages
4. Regional science policy and the growth of knowledge megacentres in bioscience clusters
5. Stillbirth in a Tertiary Care Referral Hospital in North Bengal - A Review of Causes, Risk Factors and Prevention Strategies
6. The name is absent
7. The name is absent
8. The Values and Character Dispositions of 14-16 Year Olds in the Hodge Hill Constituency
9. The Mathematical Components of Engineering
10. The name is absent