46
OJ Ct2 OtΓ 0.4 ’ ~Œ5...... d"∙6
frequency (THz)
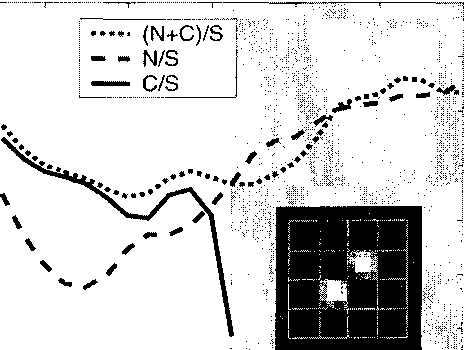
Figure 5.3 : Noise-to-signal power ratio (dashed) and noise-plus-crosstalk-to-signal
power ratio (dotted) across frequency, from which we obtain the crosstalk level (solid).
Above 0.33 THz (in the shaded area), crosstalk is buried in noise, and is therefore
unmeasurable. These ratios are calculated from their corresponding transmission
images of the 4-by-4 array of the THz SLM at every frequency. In the inset image
at 0.36 THz, two pixels are under a square voltage bias and the rest are unbiased.
A THz modulation (differential) signal is measured at each pixel using the lock-in
amplifier referenced to the square voltage.
measurement is an upper limit on the crosstalk at the device operating frequency.
5.3.3 Switching performance
To provide an illustration of the dynamic switching capability of the THz SLM, this
experiment modulates certain pixel elements for two distinct configurations. Shown
in the insets of Fig 5.4 are two double-slit configurations. The white pixel elements
are driven by a 3-kHz square wave varying between 0 and 14 volts, which is also
used as the reference for the lock-in amplifier. The array elements shown in gray
More intriguing information
1. EFFICIENCY LOSS AND TRADABLE PERMITS2. Can a Robot Hear Music? Can a Robot Dance? Can a Robot Tell What it Knows or Intends to Do? Can it Feel Pride or Shame in Company?
3. The name is absent
4. Output Effects of Agri-environmental Programs of the EU
5. Protocol for Past BP: a randomised controlled trial of different blood pressure targets for people with a history of stroke of transient ischaemic attack (TIA) in primary care
6. Picture recognition in animals and humans
7. Estimation of marginal abatement costs for undesirable outputs in India's power generation sector: An output distance function approach.
8. Modelling the Effects of Public Support to Small Firms in the UK - Paradise Gained?
9. Eigentumsrechtliche Dezentralisierung und institutioneller Wettbewerb
10. The WTO and the Cartagena Protocol: International Policy Coordination or Conflict?