Chapter 4
[AlO⅛(H+)exp(--⅛
[A10H] =-----------------[4.30]
-^Aï-
Figure 4.21 shows the experiment data and fitted curve of alumina zeta
potentials in 0.05 M NaCI brine at different pH. Zeta potential of alumina changes
from positive to negative with the increase of pH. Dashed line shows zero zeta
potential value as reference.
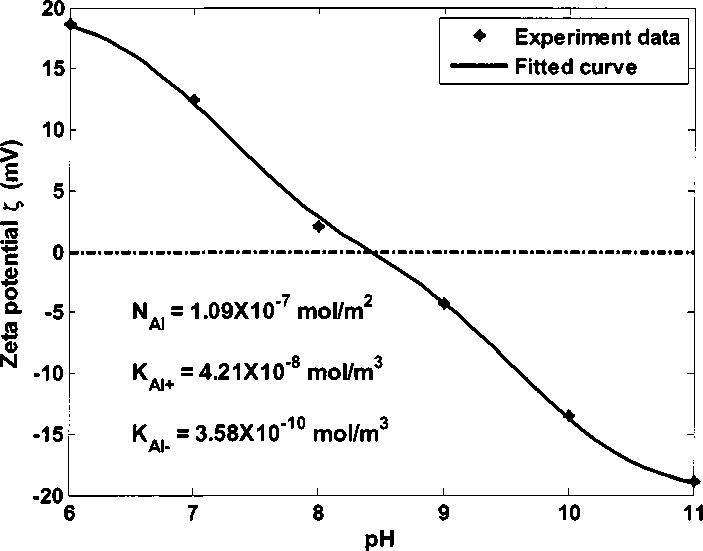
Figure 4.21 Zeta potential of alumina in 0.05 M NaCI brine at different pH
Table 4.9 shows the calculated parameters from data fitting. Dissociation
equilibrium constants and site density of alumina are 4.21 ×10'8 mol∕m3, 3.58×10^1°
mol∕m3 and 1.09×10^7 mol∕m2, respectively. For alumina sites on kaolinite, the
128
More intriguing information
1. The Determinants of Individual Trade Policy Preferences: International Survey Evidence2. Tastes, castes, and culture: The influence of society on preferences
3. Bridging Micro- and Macro-Analyses of the EU Sugar Program: Methods and Insights
4. The Response of Ethiopian Grain Markets to Liberalization
5. An Efficient Circulant MIMO Equalizer for CDMA Downlink: Algorithm and VLSI Architecture
6. Unilateral Actions the Case of International Environmental Problems
7. The name is absent
8. A Unified Model For Developmental Robotics
9. Nurses' retention and hospital characteristics in New South Wales, CHERE Discussion Paper No 52
10. DISCUSSION: POLICY CONSIDERATIONS OF EMERGING INFORMATION TECHNOLOGIES