Chapter 4
Table 4.10 shows adsorption equilibrium constants of surface reactions with
different cations and anions. Based on the calculated equilibrium constants from
experiment data correlation, silicate has larger adsorption equilibrium constants
than other ions.
Figure 4.32 shows the bar diagram of zeta potential change per unit additives
of different anions based on Figure 4.17 in Section 4.3.4. The initial value is
calculated at lower additive concentration. The average value is the average zeta
potential change with different additive concentrations.
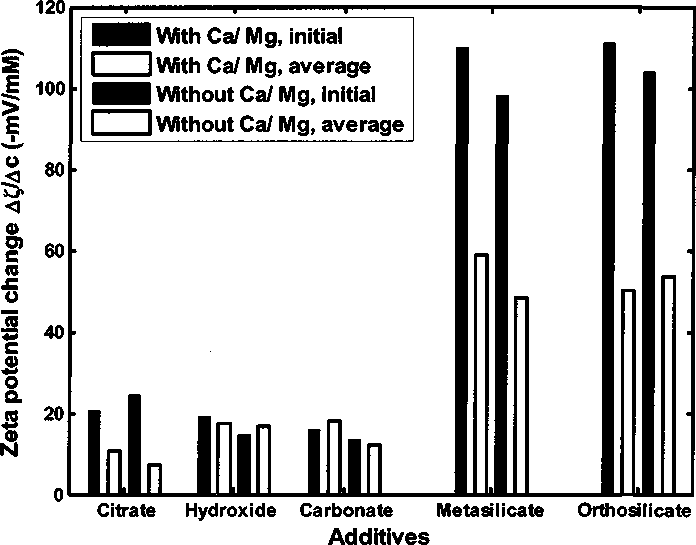
Figure 4.32 Zeta potential change with different additives in synthetic brine
Based on zeta potential results, increase of pH can make kaolinite zeta
143
More intriguing information
1. Developments and Development Directions of Electronic Trade Platforms in US and European Agri-Food Markets: Impact on Sector Organization2. Reversal of Fortune: Macroeconomic Policy, International Finance, and Banking in Japan
3. Handling the measurement error problem by means of panel data: Moment methods applied on firm data
4. PER UNIT COSTS TO OWN AND OPERATE FARM MACHINERY
5. Innovation in commercialization of pelagic fish: the example of "Srdela Snack" Franchise
6. Methods for the thematic synthesis of qualitative research in systematic reviews
7. A multistate demographic model for firms in the province of Gelderland
8. THE USE OF EXTRANEOUS INFORMATION IN THE DEVELOPMENT OF A POLICY SIMULATION MODEL
9. The name is absent
10. Partner Selection Criteria in Strategic Alliances When to Ally with Weak Partners