Chapter 3
becomes larger as time increases and exceeds the largest drop size limit that can
be measured by CPMG method. This reveals that time evolution of emulsion
adding demulsifier can be characterized via CMPG T2 distribution measurement.
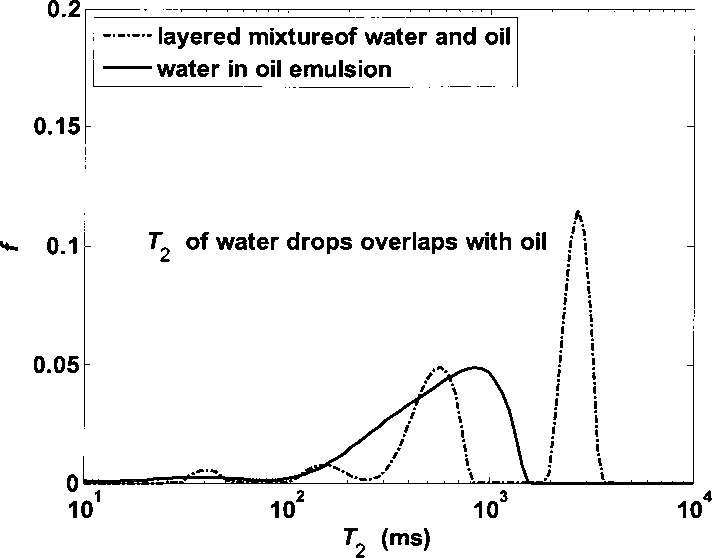
Figure 3.13 T2 distribution of layered water/ oil mixture and water in oil emulsion
Figure 3.13 shows T2 distribution of layered water/ diluted bitumen (dilution
ratio 2.4, solids-free) mixture and water in diluted bitumen (sample 1, dilution ratio
2.4, with clay solids) emulsion. In this case, T2 distribution of water in diluted
bitumen emulsion has only one peak. T2 distribution of water drops overlaps with
that of oil. T2 distribution Ofwaterdrops is not distinguishable and cannot be used
to calculate drop size distribution. To solve this problem, NMR PGSE restricted
64
More intriguing information
1. The Impact of Hosting a Major Sport Event on the South African Economy2. EXECUTIVE SUMMARY
3. ‘Goodwill is not enough’
4. The Impact of EU Accession in Romania: An Analysis of Regional Development Policy Effects by a Multiregional I-O Model
5. Stable Distributions
6. AGRIBUSINESS EXECUTIVE EDUCATION AND KNOWLEDGE EXCHANGE: NEW MECHANISMS OF KNOWLEDGE MANAGEMENT INVOLVING THE UNIVERSITY, PRIVATE FIRM STAKEHOLDERS AND PUBLIC SECTOR
7. The name is absent
8. The name is absent
9. The name is absent
10. Opciones de política económica en el Perú 2011-2015