Chapter 3
diffusion measurement is required to get drop size distribution.
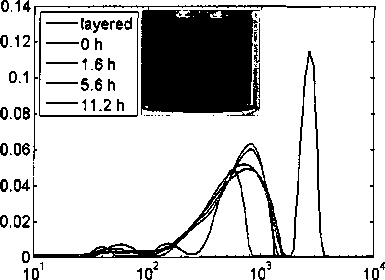
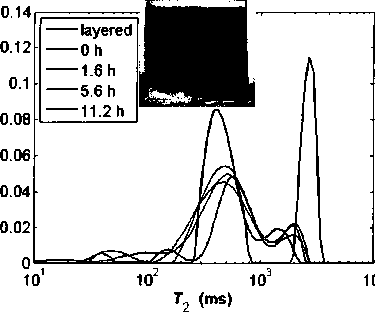
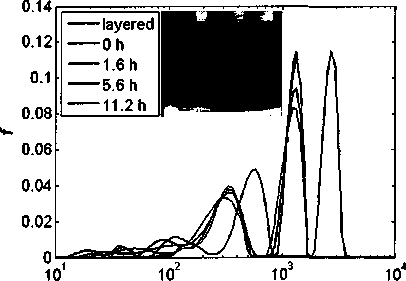
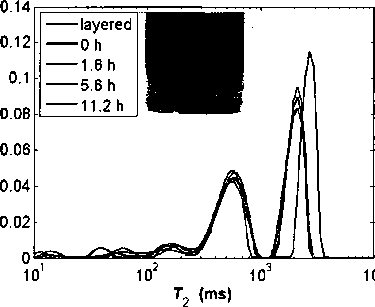
T2 distribution evolutions of emulsion samples 1 - 4 (in Table 3.2) from CPMG
measurement are shown in Figure 3.14. In the figures, T2 distribution of layered
mixture and picture of 12 h emulsion are also shown for reference.
T2 (ms)
Sample 2
Sample 1
T2 (ms)
Sample 3
Sample 4
Figure 3.14 T2 distribution of emulsion samples 1-4
In sample 2 and sample 4, 200 ppm demulsifier PR5 (120 μl 10 % PR5 in
xylene solution for the 60 ml emulsion sample) was added to each emulsion
65
More intriguing information
1. Strategic monetary policy in a monetary union with non-atomistic wage setters2. Are Public Investment Efficient in Creating Capital Stocks in Developing Countries?
3. An Economic Analysis of Fresh Fruit and Vegetable Consumption: Implications for Overweight and Obesity among Higher- and Lower-Income Consumers
4. The name is absent
5. Language discrimination by human newborns and by cotton-top tamarin monkeys
6. Insurance within the firm
7. Individual tradable permit market and traffic congestion: An experimental study
8. THE UNCERTAIN FUTURE OF THE MEXICAN MARKET FOR U.S. COTTON: IMPACT OF THE ELIMINATION OF TEXTILE AND CLOTHING QUOTAS
9. Antidote Stocking at Hospitals in North Palestine
10. PEER-REVIEWED FINAL EDITED VERSION OF ARTICLE PRIOR TO PUBLICATION