Chapter 3
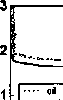
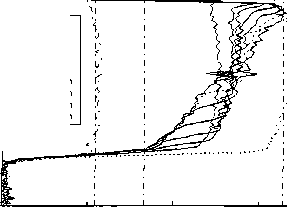
Profile of emulsions
O
water
— 0 min
— 48 min
--- 96min
--- 192 min
--- 336 min
---- 480 min
--- 672 min
Oil
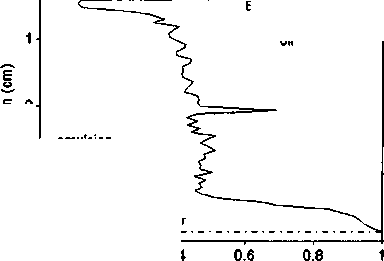
0 h φ=0.50 for calibration
-3o
Emulsified water
Watef
E
-2
0.5
1.5
A
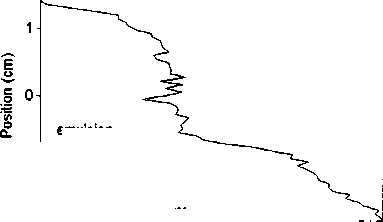
0.8 h φ=0.47
v>
-1-
O-
-1
emulsion
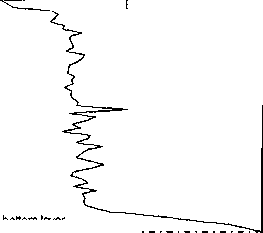
Bound ofthe bottom layer
Boundofthetoplayer
oil
2
x 105
-2+-
0
0.2
0.4 0.6
S
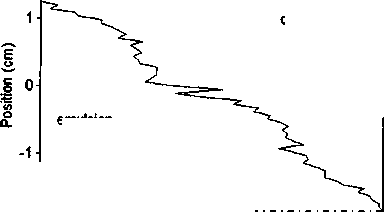
1.6 h φ=0.48
0.8
Bound Ofthetop layer
oil
emulsion
0.8
1
Bound ofthe bottom layer
0.2
0.4 0.6
S
2
Boundofthetop layer
oil
O-
Vl
emulsion
-1
Bound of the bottom layer
0.2
0.4
S
-2-f
0
5.6 h φ=0.48

Bound Ofthetop layer
11.2 h φ=0.49

Boundofthetoplayer
oil
emulsion
-1-
Bound ofthe bottom layer
0.2
0.8
-2 J-
0
oil
emulsion
Bound of the bottom layer
0.2
0.8
1
-2-C
0
0.4 0.6
S
0.4 0.6
S
Figure 3.18 Profile results and water fractions Ofsample 1 (with solids, no PR5)
75
More intriguing information
1. Staying on the Dole2. European Integration: Some stylised facts
3. Correlates of Alcoholic Blackout Experience
4. Update to a program for saving a model fit as a dataset
5. The name is absent
6. Nurses' retention and hospital characteristics in New South Wales, CHERE Discussion Paper No 52
7. Human Rights Violations by the Executive: Complicity of the Judiciary in Cameroon?
8. Return Predictability and Stock Market Crashes in a Simple Rational Expectations Model
9. The name is absent
10. Computational Experiments with the Fuzzy Love and Romance