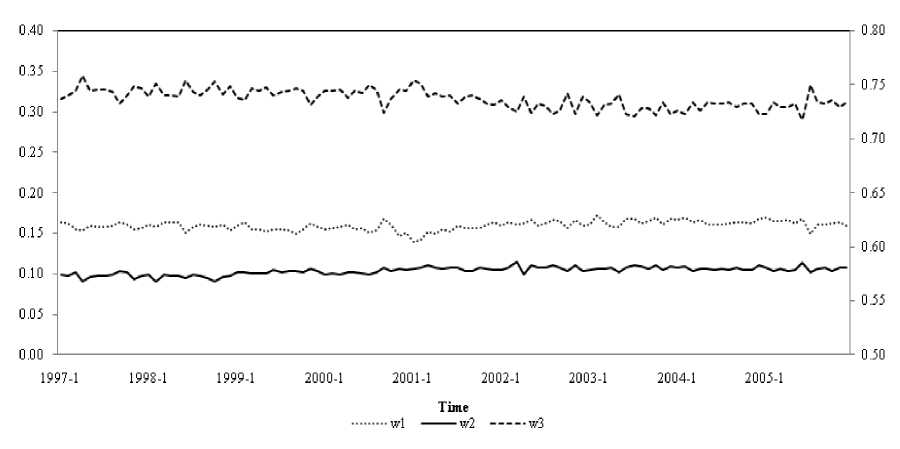
Notes: Right scale: budget share of other foods and non-durables (w3 ). Left scale: values of budget shares of healthy (w1 ) and unhealthy foods
(w2).
Figure 4: Budget shares (deseasonalised data, 1997 - 1 : 2005:12).
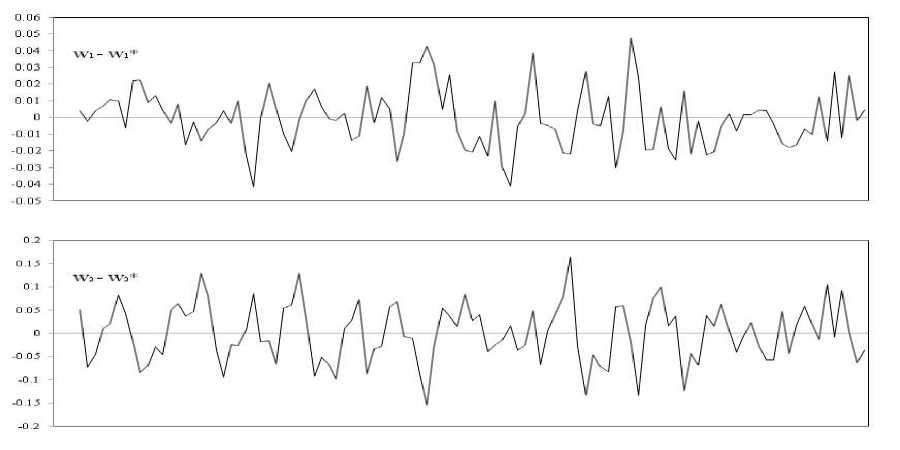
Figure 5: Deviations of observed expenditure shares from long-run equilibrium levels for healthy
(w1) and unhealthy foods (w2)
37
More intriguing information
1. Special and Differential Treatment in the WTO Agricultural Negotiations2. The name is absent
3. The name is absent
4. The name is absent
5. Estimating the Economic Value of Specific Characteristics Associated with Angus Bulls Sold at Auction
6. From Aurora Borealis to Carpathians. Searching the Road to Regional and Rural Development
7. TECHNOLOGY AND REGIONAL DEVELOPMENT: THE CASE OF PATENTS AND FIRM LOCATION IN THE SPANISH MEDICAL INSTRUMENTS INDUSTRY.
8. The name is absent
9. The name is absent
10. The name is absent