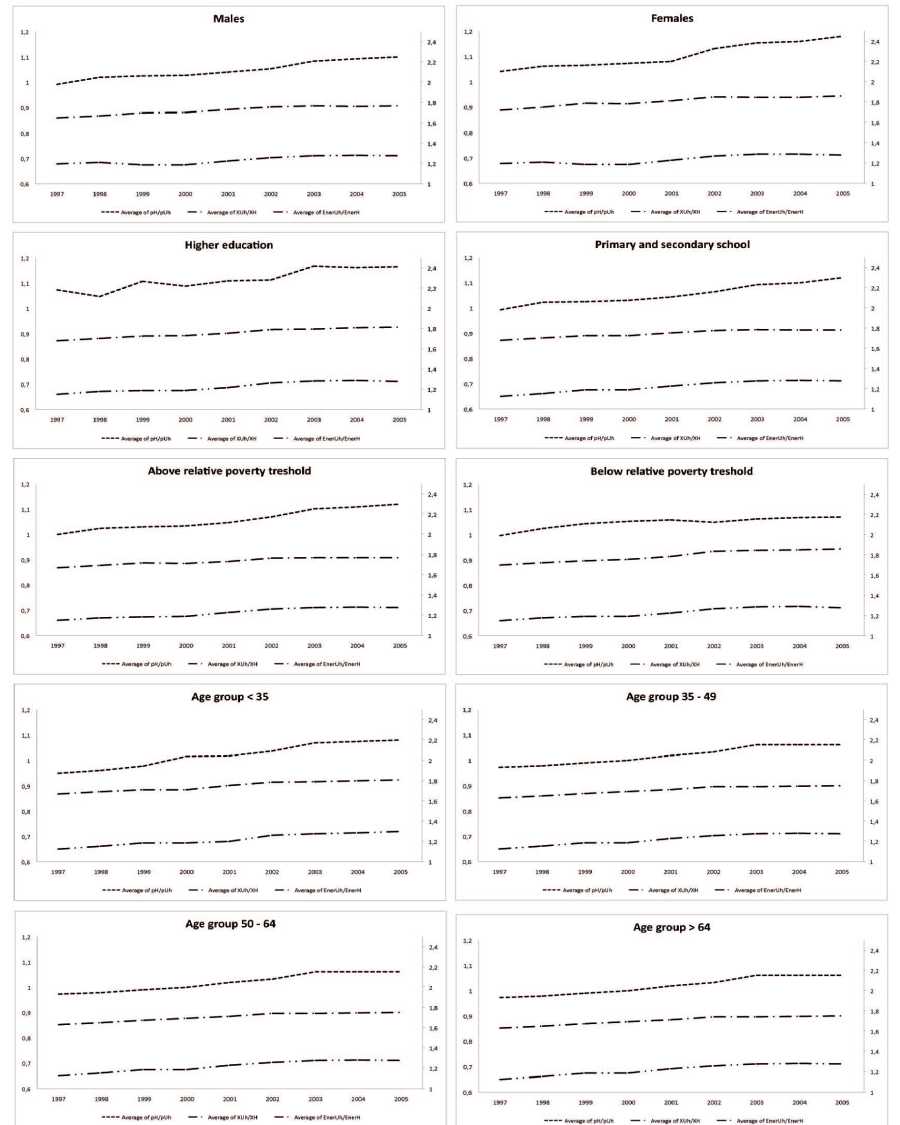
Notes: Right scale: values of healthy/unhealthy food price ratio (ph /puh ) and unhealthy/healthy food consumption ratio (xuh /xh ). Left
scale: values of unhealthy/healthy food energy ratio (eneruh /enerh ).
Figure 3: Patterns of healthy and unhealthy food prices, consumption and relative energy index
36
More intriguing information
1. The name is absent2. A Regional Core, Adjacent, Periphery Model for National Economic Geography Analysis
3. The name is absent
4. The name is absent
5. The name is absent
6. The value-added of primary schools: what is it really measuring?
7. Public Debt Management in Brazil
8. Running head: CHILDREN'S ATTRIBUTIONS OF BELIEFS
9. Credit Market Competition and Capital Regulation
10. THE CHANGING STRUCTURE OF AGRICULTURE