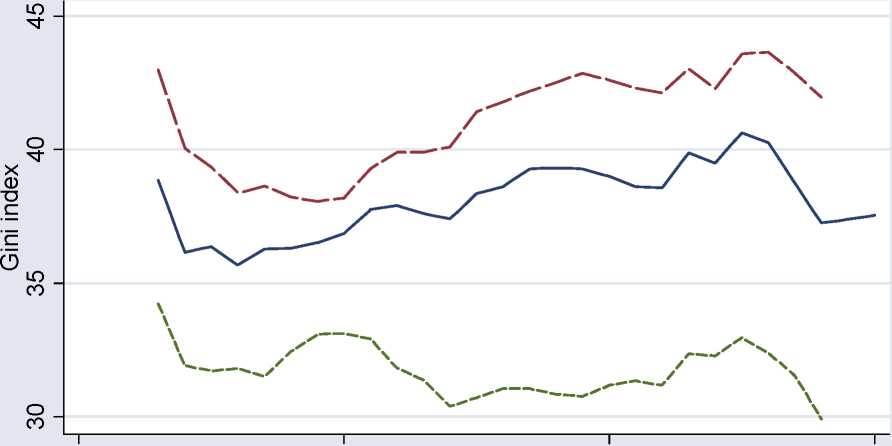
Figure 3 — Counterfactual 1: US inequality with French labour market outcomes
US with French labour share and wage differential
1970 1980 1990 2000
year
predicted ---with French labour share
with French wage ratio
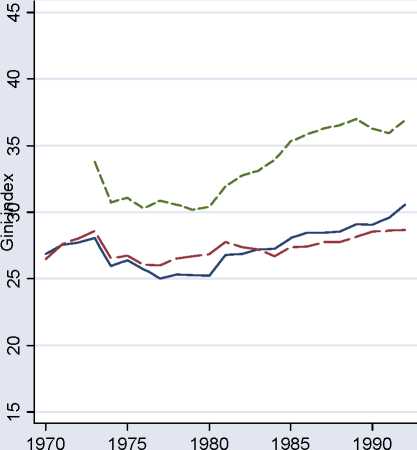
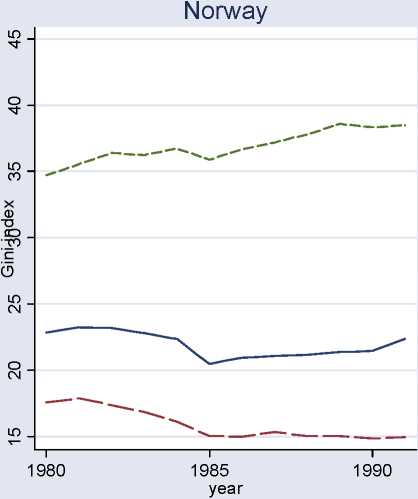
Figure 4 — Counterfactual 2: UK and Norway inequalities with US labour market outcomes
Counterfactual with US labour share and wage differential
United Kingdom
year
predicted--wth US lab.sh
----- predicted —
----wth US wage ratio
wth US lab.sh
----wth US wage ratio
24
More intriguing information
1. ISSUES IN NONMARKET VALUATION AND POLICY APPLICATION: A RETROSPECTIVE GLANCE2. Cardiac Arrhythmia and Geomagnetic Activity
3. The name is absent
4. The Evolution
5. TINKERING WITH VALUATION ESTIMATES: IS THERE A FUTURE FOR WILLINGNESS TO ACCEPT MEASURES?
6. Neighborhood Effects, Public Housing and Unemployment in France
7. Synchronisation and Differentiation: Two Stages of Coordinative Structure
8. Demand Potential for Goat Meat in Southern States: Empirical Evidence from a Multi-State Goat Meat Consumer Survey
9. The name is absent
10. IMPACTS OF EPA DAIRY WASTE REGULATIONS ON FARM PROFITABILITY