Figure 7. Assessing the Functional Form of the Life Satisfaction-GDP Gradient: Gallup World Poll
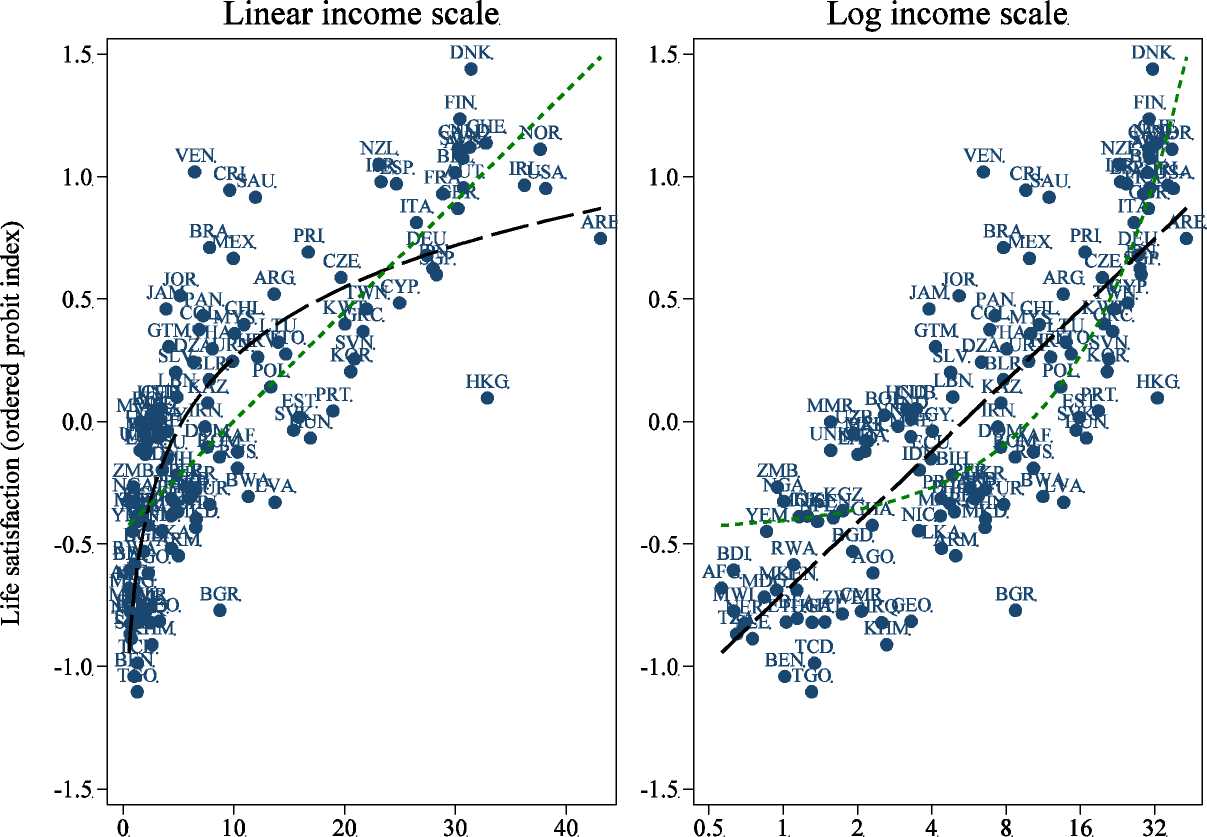
Real GDP per capita (thousands of dollars)
Source: Gallup World Poll, 2006. Sources for GDP per capita are described in the text.
Sample includes 131 developed and developing countries. See figure 4 for wording of the question. In each panel the short- and long-dashed lines are fitted from regressions of satisfaction
on GDP per capita and the log of GDP per capita, respectively. Real GDP per capita is at purchasing power parity in constant 2000 international dollars.
Figures—7
More intriguing information
1. DURABLE CONSUMPTION AS A STATUS GOOD: A STUDY OF NEOCLASSICAL CASES2. The name is absent
3. How Offshoring Can Affect the Industries’ Skill Composition
4. Effects of a Sport Education Intervention on Students’ Motivational Responses in Physical Education
5. Regulation of the Electricity Industry in Bolivia: Its Impact on Access to the Poor, Prices and Quality
6. The name is absent
7. FISCAL CONSOLIDATION AND DECENTRALISATION: A TALE OF TWO TIERS
8. The name is absent
9. The name is absent
10. A multistate demographic model for firms in the province of Gelderland