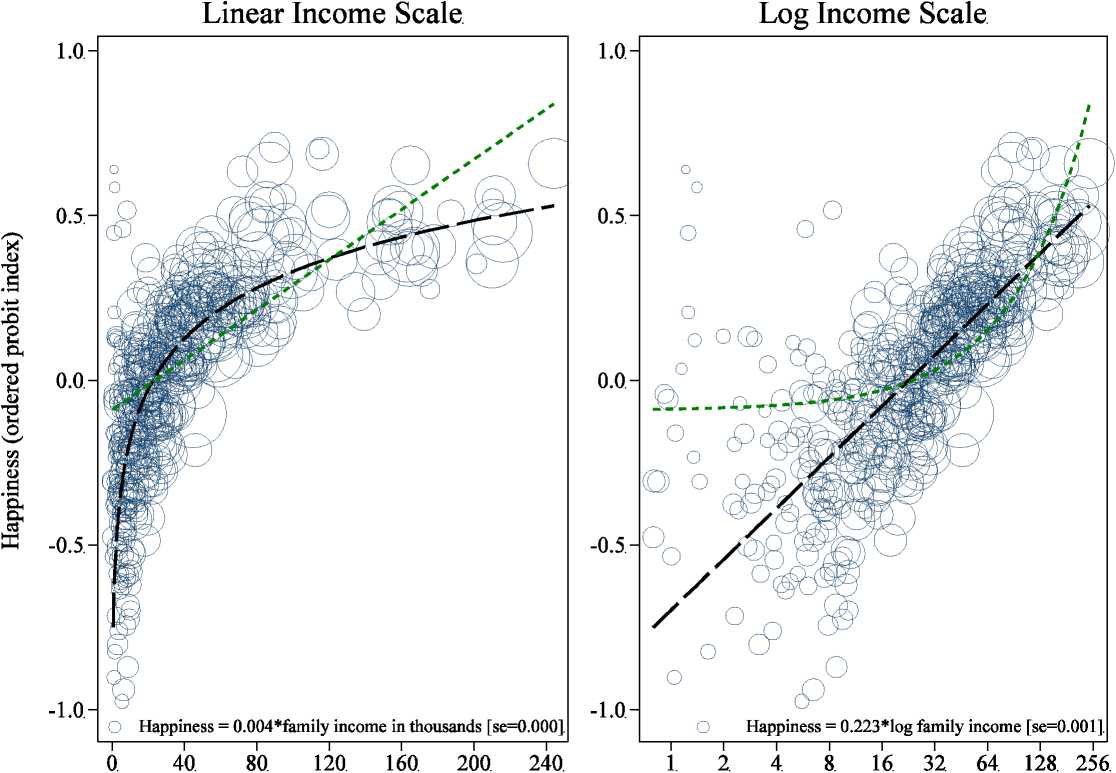
Figure 8. Assessing the Functional Form of the Happiness-Family Income Gradient: General Social Survey
Annual family income (thousands of2005 dollars)
Source: General Social Survey (USA), 1972-2006.
Notes: Each circle aggregates income and happiness for one GSS income category in one year, and its diameter is proportional to the population of that income category in that year. The
vertical axis in each panel plots the coefficients from an ordered probit regression of happiness on family income category × year fixed effects; the horizontal axis plots real family income,
deflated by the CPI-U-RS.. In each panel the short- and long-dashed lines are fitted from regressions of happiness on family income and the log of family income, respectively, weighting by
the number of respondents in each income category × year. Survey question asks, “Taken all together, how would you say things are these days—would you say that you are very happy,
pretty happy, or not too happy?”
Figures—8
More intriguing information
1. Who is missing from higher education?2. Multimedia as a Cognitive Tool
3. APPLYING BIOSOLIDS: ISSUES FOR VIRGINIA AGRICULTURE
4. Second Order Filter Distribution Approximations for Financial Time Series with Extreme Outlier
5. Social Balance Theory
6. Lumpy Investment, Sectoral Propagation, and Business Cycles
7. The name is absent
8. Qualification-Mismatch and Long-Term Unemployment in a Growth-Matching Model
9. The name is absent
10. The name is absent