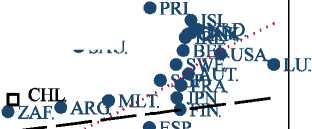
Figure 5. Subjective Well-Being and Real GDP per Capita: 1999-2004 World Values Survey
1.5-
Life Satisfaction
1.0,-
∙PR1
• МЕХ
∙MLT.
0.5-
0.0-
-0.5-
∙VEN.
□ Cl
ANGA ∙IDNi
∙KG∙VNM
∙MAJer.,,.∙∙∙, j.
∙^.W^e-∙∣5^jD]WWR ∙≡
......... ∙---- ∙INlf IR⅜ALb1⅝‰‰

^**T'Pi∙TRA
• GRC.
∙JPN.
∙KOR
'∙ HUN.
LIT
X
¾>
Й
-ι.o-
ATZA
-1.5-
.5.
1.
∙PAK
• MDA
∙ZWE
2.
∙ui⅛bl*rus∙
y = -3.20+0.35*ln(x) [se=0.04].
Correlation=O.70.
Excluding NGA and TZA: y = -3.48+0.38*ln(x) [sc=0.04].
Correlation=O. 72
4.
16
32.
1.5-
Happiness
1.0- anga
ATZA
∙VNM
0.5-
0.0-
∙PHL
''∙-.. ∙IDN.
∙UG⅛KGZ ∙≡⅛^L
∙SAU.
• МЕХ
• VEN.
... ∙" ∙PΛWBEL
⅛⅛f∙≡∙ita
∙LTU ∙hun'
∙E⅛svκ
-0.5-
∙SCG.
• ZWt IR^
∙MDA
IRN.
• BLR
ALB.
∙LVA
-ι.o-
∙ukrΛs'
-1.5-
y = -1.12+0.13*ln(x) [se=0.06].
Correlation=0.27.
Excluding NGA and TZA: y = -2.14+0.23*ln(x) [se=0.05].
Correlation=0.49.
.5.
1.
2.
4.
16
32.
Real GDP per Capita, (thousands of dollars, log scale)
Sources: World Values Survey, 1999-2004 wave. Sources for GDP per capita are described in the text.
Notes: Sample includes sixty-nine developed and developing countries. Observations represented by hollow squares are drawn from
countries in which the World Values Survey sample is not nationally representative; see appendix B for further details. Dashed lines are fitted
from the reported OLS regression; dotted lines are fitted from lowess regressions; both regressions are based only on nationally
representative samples. GDP per capita is at purchasing power parity in constant 2000 international dollars.
Life satisfaction: Question asks, “All things considered, how satisfied are you with your life as a whole these days?” and asks respondents to
choose a number from 1 (dissatisfied) to 10 (satisfied). Data are aggregated into a satisfaction index by running an ordered probit regression
of satisfaction on country × wave fixed effects.
Happiness: Question asks, “Taking all things together, would you say you are: ‘very happy,’ ‘quite happy,’ ‘not very happy,’ [or] ‘not at all
happy?’” Data are aggregated into a satisfaction index by running an ordered probit regression of happiness on country × wave fixed effects.
Figures—5
More intriguing information
1. Land Police in Mozambique: Future Perspectives2. Improving behaviour classification consistency: a technique from biological taxonomy
3. The name is absent
4. Linkages between research, scholarship and teaching in universities in China
5. Une Gestion des ressources humaines à l'interface des organisations : vers une GRH territoriale ?
6. The name is absent
7. Protocol for Past BP: a randomised controlled trial of different blood pressure targets for people with a history of stroke of transient ischaemic attack (TIA) in primary care
8. Empirical Calibration of a Least-Cost Conservation Reserve Program
9. Income Taxation when Markets are Incomplete
10. ANTI-COMPETITIVE FINANCIAL CONTRACTING: THE DESIGN OF FINANCIAL CLAIMS.