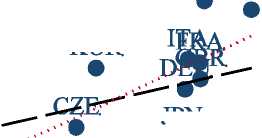
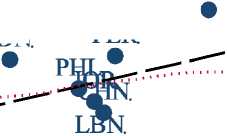
Figure 3. Life Satisfaction and Real GDP per Capita: Pew Global Attitudes Survey
1.5,-
1.0-
GTM
Xl
CD
Й
• w
0.5-
HND.
VNM ™XT
• EGY. VEN
MEX
ca⅝sλ.
ω
υ
73
о
й
O
+3
ZΛ
ед
¢/5
NGA
UZB.
0.0-
KEN
-0.5-
TZA

KOR
JPN.
bra ARG
IDN PER
BOL
PAK ..∙.∙-
IND.
BGDGHA
UGA AGO.
UKR TURRUS.
BGR
-1.0-
-1.5-
y = -1.90+0∙22*ln(x) [se=0.04].
Correlation=0.546.
.5.
1.
2.
4.
16.
32.
Real GDP per capita (thousands of dollars, log scale).
Sources: Pew Global Attitudes Survey, 2002. Sources for GDP per capita are described in the text.
Notes: Sample includes forty-four developed and developing countries. Respondents are shown a picture of a ladder with ten steps and asked, “Here is a ladder representing the ‘ladder of
life.’ Let's suppose the top of the ladder represents the best possible life for you; and the bottom, the worse possible life for you. On which step of the ladder do you feel you personally stand
at the present time?” Data are aggregated into a satisfaction index by running an ordered probit regression of satisfaction on country fixed effects. Dashed line is fitted from an OLS
regression; dotted lines are fitted from lowess regressions. Real GDP per capita is at purchasing power parity in constant 2000 international dollars.
Figures—3
More intriguing information
1. The name is absent2. Portuguese Women in Science and Technology (S&T): Some Gender Features Behind MSc. and PhD. Achievement
3. Constrained School Choice
4. Olive Tree Farming in Jaen: Situation With the New Cap and Comparison With the Province Income Per Capita.
5. The name is absent
6. Banking Supervision in Integrated Financial Markets: Implications for the EU
7. Public-Private Partnerships in Urban Development in the United States
8. The Mathematical Components of Engineering
9. Publication of Foreign Exchange Statistics by the Central Bank of Chile
10. Labour Market Institutions and the Personal Distribution of Income in the OECD