Figure 4. Life Satisfaction and Real GDP per Capita: Gallup World Poll
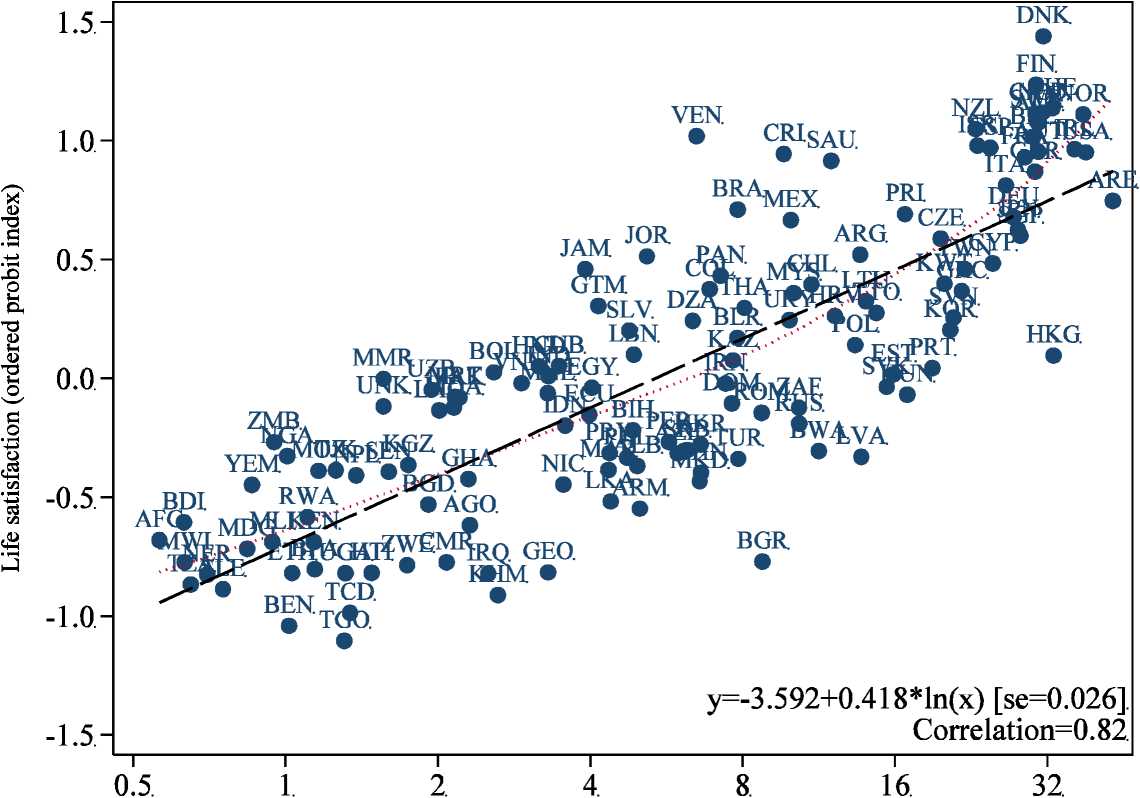
Real GDP per capita, (thousands of dollars, log scale).
Sources: Gallup World Poll, 2006; authors’ regressions. Sources for GDP per capita are described in the text.
Notes: Sample includes 131 developed and developing countries. Respondents are asked, “Please imagine a ladder with steps numbered from zero at the bottom to ten at the top. Suppose
we say that the top of the ladder represents the best possible life for you and the bottom of the ladder represents the worst possible life for you. If the top step is 10 and the bottom step is 0,
on which step of the ladder do you feel you personally stand at the present time?” Dashed line is fitted from the reported ordinary least squares regression; dotted line is fitted from a lowess
estimation. GDP per capita is at purchasing power parity in constant 2000 international dollars.
Figures—4
More intriguing information
1. The name is absent2. FISCAL CONSOLIDATION AND DECENTRALISATION: A TALE OF TWO TIERS
3. Unilateral Actions the Case of International Environmental Problems
4. Gender stereotyping and wage discrimination among Italian graduates
5. The Prohibition of the Proposed Springer-ProSiebenSat.1-Merger: How much Economics in German Merger Control?
6. PACKAGING: A KEY ELEMENT IN ADDED VALUE
7. The name is absent
8. Synchronisation and Differentiation: Two Stages of Coordinative Structure
9. Program Semantics and Classical Logic
10. A Pure Test for the Elasticity of Yield Spreads