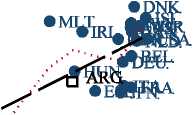
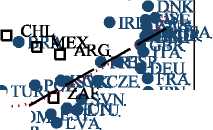
Figure 2. Life Satisfaction and Real GDP per Capita: World Values Survey

1.5.
1.0
0.5
0.0
-0.5.
-1.0
-1.5
1981-84 wave
1.5-
1.0-
1989-93 wave
• KOR
y = -4.50+0.50*ln(x) [sc=0.25].
Correlation=!).53.
.5. 1. 2. 4. 8. 16. 32.
0.5-
0.0-
-0.5.-
-1.0-
-1.5.-
□ CHN.
□ NGA □ ind∙
• MLT. ∙CJJE
∙JPN.
∙⅛O
• BLR -∙rus.
∙BGR
y = -5-21+0.56*ln(x) [sc=0.10].
CorrcIation=O.71
.5. 1. 2. 4. 8. 16. 32.
1.5.
1.0
0.5
0.0
-0.5.
-1.0
-1.5
1994-99 wave
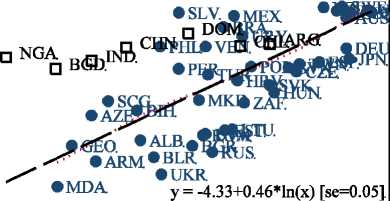
Correlation=!).70.
1.5.
1.0
0.5
0.0
-0.5.
-1.0.
-1.5.
1999-2004 wave
∙PRI
∙mex∙ml
• VEN.
□
• NGA
..∙u
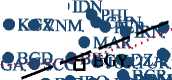

JPN.
∙TZA
• ZWE
y = -3,20+0.35*ln(x) [se=0.05].
Correlation=O. 70.
.5. 1. 2. 4. 8. 16. 32.
.5. 1. 2. 4. 8. 16. 32.
Real GDP per Capita (thousands of dollars, log scale)
Sources: World Values Survey. Sources for GDP per capita are described in the text.
Notes: Sample includes twenty (1981-84), forty-two (1989-93), fifty-two (1994-99), or sixty-nine (1999-2004) countries; see text for details
of the sample. Observations represented by hollow squares are drawn from countries in which the World Values Survey sample is not
nationally representative; see appendix B for further details. Respondents are asked, “All things considered, how satisfied are you with your
life as a whole these days?” and asks respondents to choose a number from 1 (completely dissatisfied) to 10 (completely satisfied). Data are
aggregated into a satisfaction index by running an ordered probit regression of satisfaction on country × wave fixed effects. Dashed lines are
fitted from an OLS regression; dotted lines are fitted from lowess regressions. These lines and the reported regressions are fitted only from
nationally representative samples. Real GDP per capita is at purchasing power parity in constant 2000 international dollars.
Figures—2
More intriguing information
1. The name is absent2. The name is absent
3. The name is absent
4. The name is absent
5. Proceedings of the Fourth International Workshop on Epigenetic Robotics
6. Perceived Market Risks and Strategic Risk Management of Food Manufactures: Empirical Results from the German Brewing Industry
7. Understanding the (relative) fall and rise of construction wages
8. Großhandel: Steigende Umsätze und schwungvolle Investitionsdynamik
9. Commitment devices, opportunity windows, and institution building in Central Asia
10. WP RR 17 - Industrial relations in the transport sector in the Netherlands