Uncertain Productivity Growth
4 TIMING & COMPARATIVE STATICS
By integrating the probability density function (69) it is possible to derive the corresponding
cumulative distribution functions as
G(T*,⅞A*) = N
+ (α
1 σ2)T*
+e
(α
1 σ2)t
(74)
with ⅛ << and i ∈{E,F}.
* *■*
Expected Market Entry Time Te, Tf
(a) ¾ < ⅛F, α = 0.04,⅛0 = 1,σ = 0.1, but
FF (ð) > FE (ð) with κ = 1

(b) ¾ < ⅛F, α = 0.04,⅛0 = 1,σ = 0.16, but
FF (tf) > FE (tf) with κ = 1
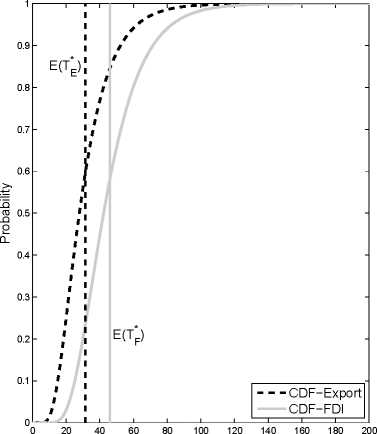
Figure 8: Cumulative Distribution Functions of Ti*.
Panel a) in figure 8 represents the cumulative distribution functions of both investment strategies
for a relative cost constellation which leads to a productivity cut-off ranking with tf*E < &р. The
vertical dashed line represents the export mode’s expected market entry time and the s-shaped
curve its cumulative distribution function. The continuous curves represent the FDI mode. In
the underlying example the export mode exhibits a first-order stochastic dominance over the FDI
strategy. Differently expressed, for any market entry time Ti* , the probability of market entry
through exports will always be higher than in the FDI case. However, for the chosen relative cost
pattern, the FDI mode exhibits a higher option value (see figure 7, areas F2 , F3) and therefore
32
More intriguing information
1. Global Excess Liquidity and House Prices - A VAR Analysis for OECD Countries2. Long-Term Capital Movements
3. Announcement effects of convertible bond loans versus warrant-bond loans: An empirical analysis for the Dutch market
4. HACCP AND MEAT AND POULTRY INSPECTION
5. Putting Globalization and Concentration in the Agri-food Sector into Context
6. DIVERSITY OF RURAL PLACES - TEXAS
7. The name is absent
8. Linkages between research, scholarship and teaching in universities in China
9. Convergence in TFP among Italian Regions - Panel Unit Roots with Heterogeneity and Cross Sectional Dependence
10. The Economics of Uncovered Interest Parity Condition for Emerging Markets: A Survey