Chart 9 Sectoral shifts and volatility (cont’d)
Actual shares
12.00
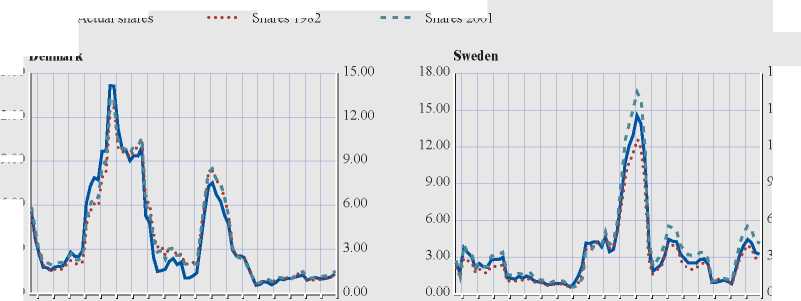
Shares 1982
Shares 2001
Denmark
15.00
18.00
15.00
12.00
9.00
6.00
6.00
3.00
3.00
0.00
1983 1985 1987 1989 1991 1993 1995 1997 1999 2001
0.00
1983 1985 1987 1989 1991 1993 1995 1997 1999 2001
9.00
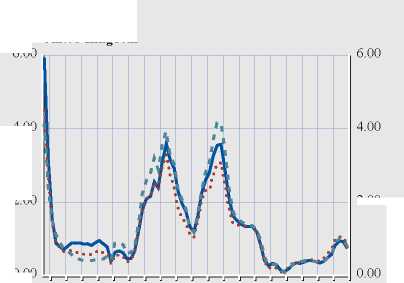
United Kingdom
6.00
0.00
1983 1985 1987 1989 1991 1993 1995 1997 1999 2001
4.00
2.00
2.00
The figure reports the variance of the aggregate business
cycle component at the actual sectoral specialisation for
each individual observation (solid line) and the variance
of the aggregate business cycle component where the
sectoral specialisation has been fixed at its initial value
(dashed line).
Sources : Eurostat, NCBs, ECB calculations.
Note: See Annex 4.2.2.2 for a discussion of the underlying methodology and a presentation of volatility developments using the same scale for
all countries.
almost consistently lower over the period after
1991 following the increased weight of low-
volatility business sector services. Finally,
Sweden seems to have experienced a slight
increase of its aggregate volatility, mainly on
account of a slightly increasing share of
industry in its final output.
3.3 BUSINESS CYCLE SYNCHRONISATION
ACROSS EU COUNTRIES: SECTORAL
ORIGINS
Business cycle synchronisation relates to the
degree of co-movement of aggregate production
across a group of countries. Analysing the
synchronisation of business cycles at the
sectoral level is relevant in this respect, given
that changes in the composition of output could
have impacted upon business cycle
synchronisation. Nevertheless, additional
factors may offset the negative impact of
sectoral specialisation on the harmonisation of
business cycles, as will be discussed in the next
section.50
50 It is, however, not clear how precisely convergence between
business cycles should be assessed. Different suggestions have
been put forward, including increased bivariate correlations,
decreased cyclical disparity or emerging common factors that
drive individual countries’ business cycles. Using the business
cycle components presented in the preceding section, bivariate
correlations have been preferred here. For an overview of
measures of business cycle synchronisation, see M. Massmann
and J. Mitchell (2002), “Have UK and euro zone business cycles
become more correlated?”, National Institute Economic
Review, 182. For a recent analysis of the factors driving business
cycle synchronisation in G7 countries, see A. Monfort, J.-P.
Renne, R. Rüffer and G. Vitale (2003), “Is economic activity in
the G7 synchronised? Common shocks versus spillover effects”,
CEPR Discussion Paper, 4119.
42
ECB
Occasional Paper No. 19
July 2004
More intriguing information
1. The name is absent2. Strategic Policy Options to Improve Irrigation Water Allocation Efficiency: Analysis on Egypt and Morocco
3. Parent child interaction in Nigerian families: conversation analysis, context and culture
4. Evidence on the Determinants of Foreign Direct Investment: The Case of Three European Regions
5. Tobacco and Alcohol: Complements or Substitutes? - A Statistical Guinea Pig Approach
6. The Mathematical Components of Engineering
7. The name is absent
8. The name is absent
9. CAN CREDIT DEFAULT SWAPS PREDICT FINANCIAL CRISES? EMPIRICAL STUDY ON EMERGING MARKETS
10. Biological Control of Giant Reed (Arundo donax): Economic Aspects