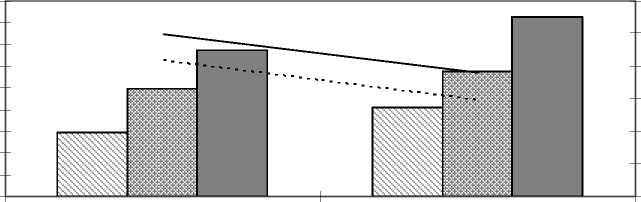
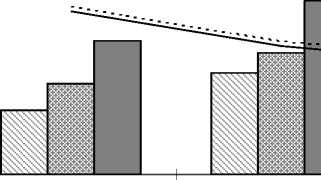
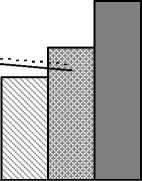
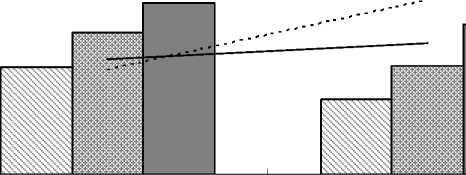
Figure 1: Annual Wages and Corporate Tax Rates
Denmark
10.8
10.7
⅛ 10.6
f 10.5
1 10.4
= 10.3
= 10.2
∙≡" 10.1
^j 10
9.9
1987
1992
0.6
0.5
0.4 λ
0.3 &
X
0.2 н
0.1
0
Year
I I Low I I Mid I I High-------Marg. Corp. Tax.......Avg. Corp. Tax
France
10.8

10.6 -
10.4 -
10.2 -
10 -
9.8 -
9.6 -
9.4 -
9.2 -
1984
0.6
0.5
0.4 λ
0.3 &
X
0.2 H
0.1
0
1989 1994
Year
I I Low I I Mid
High
Marg. Corp. tax
Avg. Corp. tax
Greece

10
9.8
9.6
9.4
9.2
9
8.8
8.6
0.6
0.5
0.4 <H
0.3 ×
0.2 H
0.1
0
1995
2000
I I Low I I Mid
High
Year
Marg. Corp. Tax
Avg. Corp. Tax
29
More intriguing information
1. The name is absent2. The name is absent
3. The Environmental Kuznets Curve Under a New framework: Role of Social Capital in Water Pollution
4. Learning and Endogenous Business Cycles in a Standard Growth Model
5. American trade policy towards Sub Saharan Africa –- a meta analysis of AGOA
6. The name is absent
7. A model-free approach to delta hedging
8. Credit Market Competition and Capital Regulation
9. The name is absent
10. Ventas callejeras y espacio público: efectos sobre el comercio de Bogotá