Eichenbaum-
Evans
EE
BIG
0.3
0.1
0
-0.1
US/UK q
0.5
0
У -0.5
-1
1.50 1 2 3 4 5
years
US i
0.2
0.1
0.10 1 2 3 4 5
years
y*
US p
-0.3
0 1 2 3 4 5
years
0.5
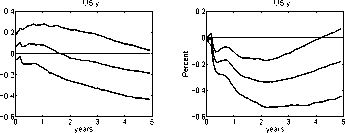
US y
0
0 1 2 3 4 5
years
UK y*
0.5
0
-0.5
10 1 2 3 4 5
years
0
-
-
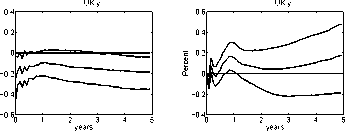
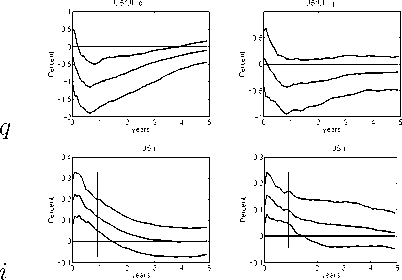
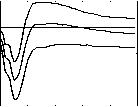
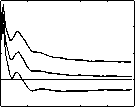
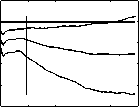
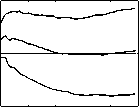
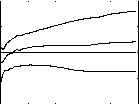
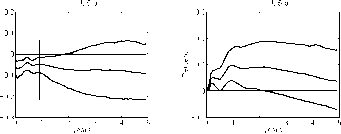
Figure 8: Comparison of results. For a US monetary policy contraction and
the US-UK country pair, we compare the benchmark identification in EE to
the BIG specification and the original identification of Eichenbaum-Evans.
Note the “price puzzle” in the Eichenbaum-Evans column.
41
More intriguing information
1. The name is absent2. Accurate, fast and stable denoising source separation algorithms
3. FDI Implications of Recent European Court of Justice Decision on Corporation Tax Matters
4. The Challenge of Urban Regeneration in Deprived European Neighbourhoods - a Partnership Approach
5. Understanding the (relative) fall and rise of construction wages
6. Antidote Stocking at Hospitals in North Palestine
7. Sex differences in the structure and stability of children’s playground social networks and their overlap with friendship relations
8. Herman Melville and the Problem of Evil
9. THE AUTONOMOUS SYSTEMS LABORATORY
10. Trade Openness and Volatility