13
Graphical Data Representation in Bankruptcy Analysis
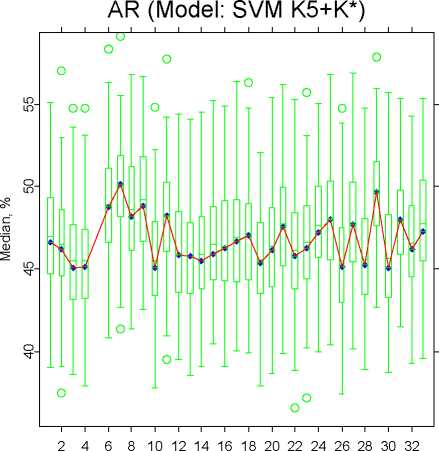
Variable No.
Fig. 9. Accuracy ratios for bivariate SVM models. Each model includes variable K5
and one of the remaining. Box-plots are estimated basing on 100 random subsamples.
Here a k-nearest-neighbour Gaussian kernel was used. h is the kernel band-
width.
The preliminary PDs evaluated in this way are not necessarily a mono-
tonical function of the score. The monotonisation of PDi, i = 1, 2, . . . , n is
achieved at step two using the Pool Adjacent Violator (PAV) algorithm ([2]
and [13]). As a result we obtain monotonised probabilities of default P D(xi)
for the observations of the training set.
Finally, at step three the PDs are computed for any observation described
with x as an interpolation between two PDs of the neighbouring, in terms of
the score, observations from the training set, xi and xi-1 , i = 2, 3, . . . , n:
PD(x) = PD(xi) + f (x) - f(xi-1) {PD(xi) - PD(xi-ι)} . (12)
f(xi) - f(xi-1)
If the score for an observation x lies beyond the range of scores for the training
set, then P D(x) equals to the score of the first neighbouring obseration of the
training set.
Figure 12 is an example of the cumulative PD curve (power curve) and
estimated PDs for a subsample of 200 companies. The PD curve has a plateau
area for the observations with a high score. Default probabilities can change
from 15% to 80% depending on the score.
More intriguing information
1. Determinants of Household Health Expenditure: Case of Urban Orissa2. On the estimation of hospital cost: the approach
3. The name is absent
4. Perfect Regular Equilibrium
5. ‘Goodwill is not enough’
6. Real Exchange Rate Misalignment: Prelude to Crisis?
7. The name is absent
8. Visual Artists Between Cultural Demand and Economic Subsistence. Empirical Findings From Berlin.
9. The name is absent
10. Cultural Diversity and Human Rights: a propos of a minority educational reform