20
W. K. Hardle, R. A. Moro, and D. Schafer
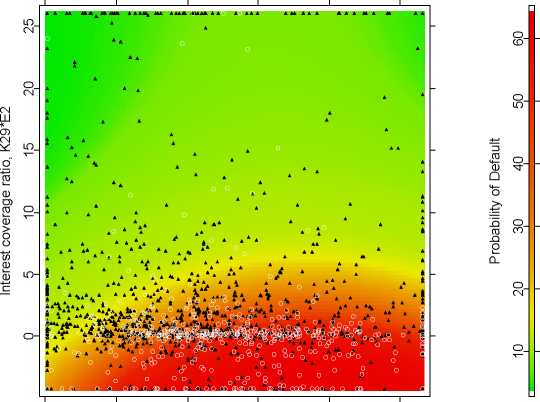
Probability of Default
6 7 8 9 10 11
Company size, K33
Fig. 16. Probability of default estimated for a random subsample of 500 failing and
500 surviving companies plotted for the variables K33 and K29. An SVM of average
complexity with the radial basis kernel 4Σ1/2 was used.
More intriguing information
1. Integrating the Structural Auction Approach and Traditional Measures of Market Power2. Fertility in Developing Countries
3. Økonomisk teorihistorie - Overflødig information eller brugbar ballast?
4. The Tangible Contribution of R&D Spending Foreign-Owned Plants to a Host Region: a Plant Level Study of the Irish Manufacturing Sector (1980-1996)
5. The name is absent
6. An Investigation of transience upon mothers of primary-aged children and their school
7. The Employment Impact of Differences in Dmand and Production
8. The name is absent
9. Language discrimination by human newborns and by cotton-top tamarin monkeys
10. Delayed Manifestation of T ransurethral Syndrome as a Complication of T ransurethral Prostatic Resection