Graphical Data Representation in Bankruptcy Analysis
21
Probability of Default
6 7 8 9 10 11
Company size, K33
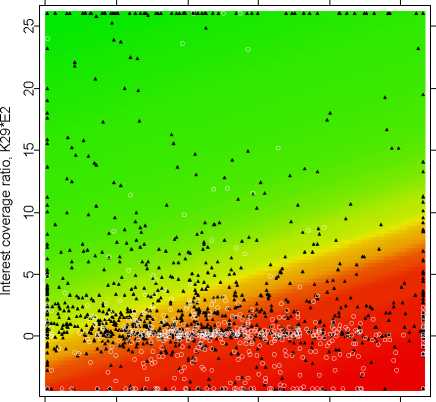
Fig. 17. Probability of default estimated for a random subsample of 500 failing and
500 surviving companies plotted for the variables K33 and K29. An SVM of low
complexity with the radial basis kernel 100Σ1/2 was used.
More intriguing information
1. The name is absent2. A Unified Model For Developmental Robotics
3. Large Scale Studies in den deutschen Sozialwissenschaften:Stand und Perspektiven. Bericht über einen Workshop der Deutschen Forschungsgemeinschaft
4. How much do Educational Outcomes Matter in OECD Countries?
5. The name is absent
6. The name is absent
7. Momentum in Australian Stock Returns: An Update
8. For Whom is MAI? A theoretical Perspective on Multilateral Agreements on Investments
9. Draft of paper published in:
10. Testing Gribat´s Law Across Regions. Evidence from Spain.