22
W. K. Hardle, R. A. Moro, and D. Schafer
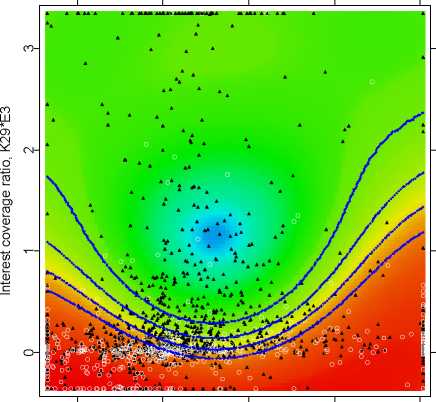
Probability of Default
-20 0 20 40 60
Net income change, K21
Fig. 18. Probability of default plotted for the variables K21 and K29. The b ound-
aries of five risk classes are shown in blue, which correspond to the rating classes:
BBB and above (investment grade), BB, B+, B, B- and lower.
More intriguing information
1. Publication of Foreign Exchange Statistics by the Central Bank of Chile2. The name is absent
3. PROTECTING CONTRACT GROWERS OF BROILER CHICKEN INDUSTRY
4. The name is absent
5. Handling the measurement error problem by means of panel data: Moment methods applied on firm data
6. Income Mobility of Owners of Small Businesses when Boundaries between Occupations are Vague
7. Macroeconomic Interdependence in a Two-Country DSGE Model under Diverging Interest-Rate Rules
8. The name is absent
9. Delivering job search services in rural labour markets: the role of ICT
10. Sectoral Energy- and Labour-Productivity Convergence