Graphical Data Representation in Bankruptcy Analysis
19
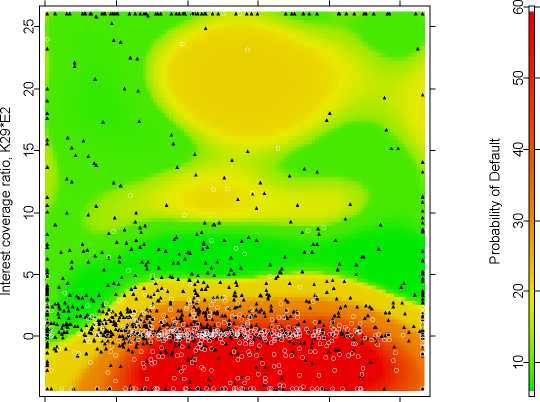
Probability of Default
6 7 8 9 10 11
Company size, K33
Fig. 15. Probability of default estimated for a random subsample of 500 failing and
500 surviving companies plotted for the variables K33 and K29. An SVM of high
complexity with the radial basis kernel 0.5Σ1/2 was used.
19. Weyl, H.: 1928, Gruppentheorie und Quantenmechanik. Hirzel, Leipzig.
More intriguing information
1. Novelty and Reinforcement Learning in the Value System of Developmental Robots2. Developmental changes in the theta response system: a single sweep analysis
3. The value-added of primary schools: what is it really measuring?
4. The Impact of Individual Investment Behavior for Retirement Welfare: Evidence from the United States and Germany
5. THE WAEA -- WHICH NICHE IN THE PROFESSION?
6. The name is absent
7. The name is absent
8. Opciones de política económica en el Perú 2011-2015
9. The name is absent
10. AGRICULTURAL PRODUCERS' WILLINGNESS TO PAY FOR REAL-TIME MESOSCALE WEATHER INFORMATION