W. K. Hardle, R. A. Moro, and D. Schafer
3 Company Score Evaluation
The company score is computed as:
f (x) = xτw + b,
(9)
where w = ^П=1 αiyixi and b = 11 (x+ + x-)τw; x+ and x- are the obser-
vations from the opposite classes for which constraint (1) becomes equality.
By substituting the scalar product with a kernel function we will derive a
non-linear score function:
n
f(x) = K(xi , x)αi yi + b.
(10)
i=1
The non-parametric score function (10) does not have a compact closed
form representation. This necessitates the use of graphical tools for its visu-
alisation.
4 Variable Selection
In this section we describe the procedure and the graphical tools for selecting
the variables of the SVM model used in forecasts. We have two most im-
portant criteria of model accuracy: the accuracy ratio (AR), which will be
used here as a criterion for model selection, (Figure 6) and the percentage of
correctly classified out-of-sample observations. Higher values indicate better
model accuracy.
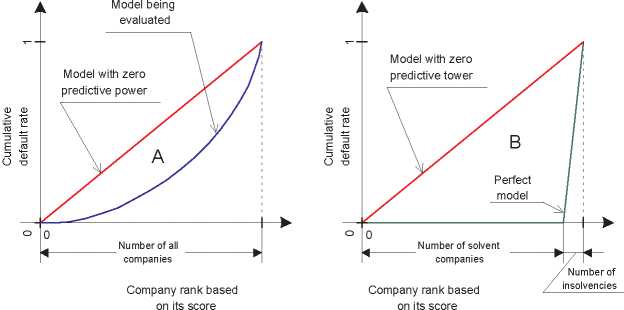
Fig. 6. The power curves for a perfect (green), random (red) and some real (blue)
classification models. The AR is the ratio of two areas A/B. It lies between 0 for a
random model with no predictive power and 1 for a perfect model.
More intriguing information
1. Behaviour-based Knowledge Systems: An Epigenetic Path from Behaviour to Knowledge2. The name is absent
3. Happiness in Eastern Europe
4. The name is absent
5. The Role of State Trading Enterprises and Their Impact on Agricultural Development and Economic Growth in Developing Countries
6. The name is absent
7. The name is absent
8. Cyber-pharmacies and emerging concerns on marketing drugs Online
9. Innovation Policy and the Economy, Volume 11
10. Empirical Calibration of a Least-Cost Conservation Reserve Program