1200
1000
7000
6500
6000
5500
5000
4500
4000
3500
3000
2500
2000
0 500 1000 1500 2000 2500
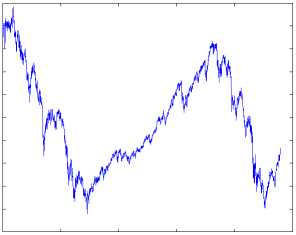
(a) Underlying asset: daily values of the CAC from
28 April 2000 until 18 September 2009
3000
inria-00457222, version 1 - 16 Feb 2010
800
600
400
200
Il ' ” All
∣W ' ....... λ∕⅜
It I ' l5" Æ M
s. ⅛ ....... ' А
0 200 400 600 800 1000 1200
0 200 400 600 800 1000 1200
(b) Option: CFU9PY3500 daily prices from 9 May (c) Option: CFU9CY3500 daily prices from 9 May
2009 until 18 September 2009
2009 until 18 September 2009
Figure 1: Daily data
4 Conclusion
Lack of space prevented us from examining more involved options, futures, and
other derivatives, than in Section 2.3. Subsequent works will do that, and also
introduce several time scales thanks to the nonstandard analytic framework of
the Cartier-Perrin theorem [4].
Acknowledgement. The authors would like to thank Frederic Hatt for stim-
ulating discussions.
References
[1] BechU T., Bertrand E., Nebenzahl J., L’analyse technique (6e ed.),
Economica, 2008.
[2] Bernhard P., El Farouq N., Thiery S., Robust control approach
to option pricing: a representation theorem and fast algorithm, SIAM J.
Control Optimiz., 46, 2280-2302, 2007.
More intriguing information
1. The name is absent2. On the job rotation problem
3. Multimedia as a Cognitive Tool
4. The Prohibition of the Proposed Springer-ProSiebenSat.1-Merger: How much Economics in German Merger Control?
5. The name is absent
6. Large-N and Large-T Properties of Panel Data Estimators and the Hausman Test
7. The name is absent
8. The name is absent
9. On the Relation between Robust and Bayesian Decision Making
10. Problems of operationalizing the concept of a cost-of-living index