Figure 3: Fiscal Imbalances
Tax and Non-Tax Revenues and Expenditure of Sub-Central Governments
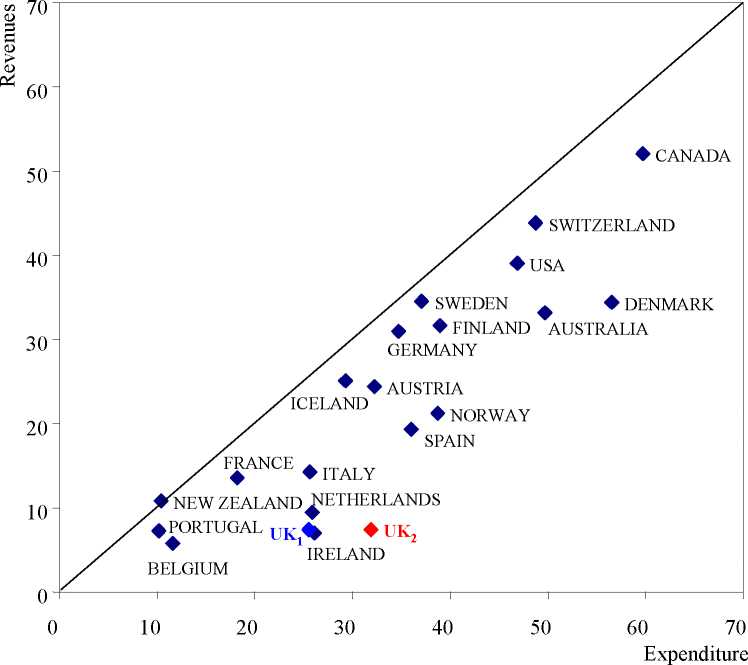
Source: IMF Government Financial Statistics
Notes:
1. Revenues include taxes, fees and other sources of non-tax revenues but exclude grants.
2. The figures are expressed as percentages of general government totals. Transfers from central
government to lower tiers of government are excluded from the general government figure.
3. The date for which each country’s data is plotted is given in the notes to figure 1.
Another indication of the extent to which governments have access to their own taxation
resources to meet their expenditure commitments is given by Figure 3. This shows the degree
of vertical imbalances present in the taxation and expenditure systems of various OECD
countries. More specifically, Figure 3 plots the share of sub-central tax and non-tax revenues
excluding grants against expenditure by sub-central governments, both given as percentages
of the appropriate general government totals. The vertical distance between each point and
the 45-degree line shows the extent to which sub-central jurisdictions are dependent on
central government grants. We have shown two points for the UK, with UK1 showing the
pre-devolution position and UK2, the situation after devolution (there is obviously no change
12
More intriguing information
1. Has Competition in the Japanese Banking Sector Improved?2. Macro-regional evaluation of the Structural Funds using the HERMIN modelling framework
3. The name is absent
4. Howard Gardner : the myth of Multiple Intelligences
5. The Distribution of Income of Self-employed, Entrepreneurs and Professions as Revealed from Micro Income Tax Statistics in Germany
6. The name is absent
7. Handling the measurement error problem by means of panel data: Moment methods applied on firm data
8. The name is absent
9. The name is absent
10. GENE EXPRESSION AND ITS DISCONTENTS Developmental disorders as dysfunctions of epigenetic cognition