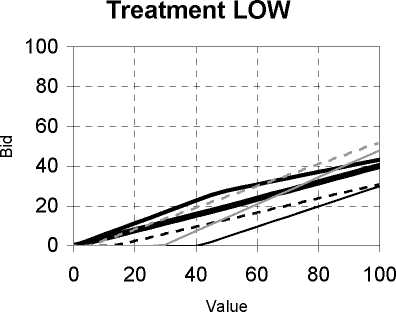
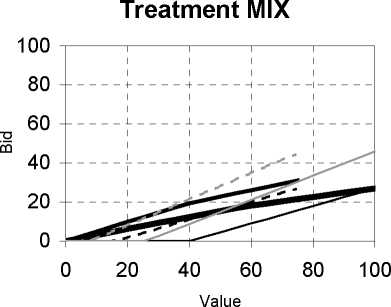

^^^“Strong
----Weak
-----RNNE (S)
.....RNNE (W)
-----RANE (S)
.....RANE (W)
Figure 1: Average Bid Functions (all rounds)
Table 6 reports the average RSDs and the test results of a comparison to the Nash equilibrium
predictions we considered. The deviations from the RNNE and RANE predictions are
relatively small, between 4% and 17% of the maximum possible deviations. However, those
from RANE are significantly smaller than those from RNNE for both Strong and Weak
bidders only in the symmetric treatment. In the asymmetric treatments, with the exception of
Strong bidders in MIX for whom the RNNE model outperforms the RANE one, the two
models perform equally well in explaining deviations. Deviations from RANE are also
significantly smaller in the symmetric treatment than in the asymmetric ones. As these
16
More intriguing information
1. The name is absent2. The name is absent
3. Accurate, fast and stable denoising source separation algorithms
4. Kharaj and land proprietary right in the sixteenth century: An example of law and economics
5. The name is absent
6. The name is absent
7. Publication of Foreign Exchange Statistics by the Central Bank of Chile
8. The Role of area-yield crop insurance program face to the Mid-term Review of Common Agricultural Policy
9. Demand Potential for Goat Meat in Southern States: Empirical Evidence from a Multi-State Goat Meat Consumer Survey
10. Implementation of Rule Based Algorithm for Sandhi-Vicheda Of Compound Hindi Words