Figure 3. Estimates of θt for regional banks
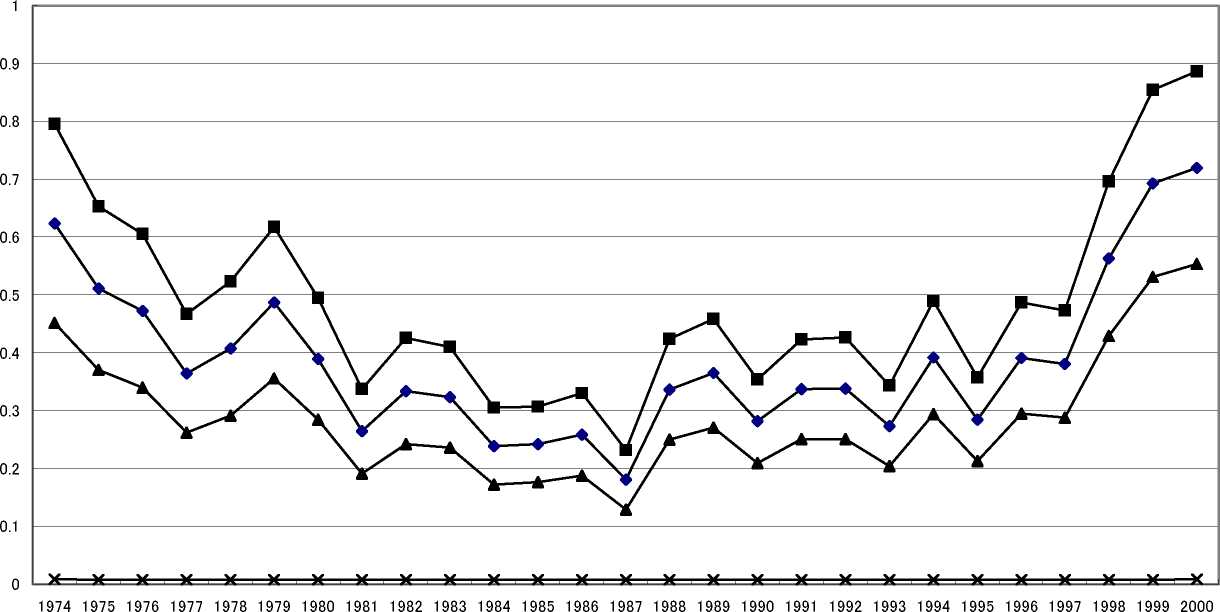
— —estimates
—■—95% upper
—⅛—95% lower
—X— 1/n
Note: MVR estimates of θt in Table 3 are shown with their 95% confidence interval. Line of 1/n corresponds to Cournot oligopoly, line at zero to
perfect competition, and line at unity to joint profit maximization.
31
More intriguing information
1. Demand Potential for Goat Meat in Southern States: Empirical Evidence from a Multi-State Goat Meat Consumer Survey2. Olfactory Neuroblastoma: Diagnostic Difficulty
3. IMMIGRATION POLICY AND THE AGRICULTURAL LABOR MARKET: THE EFFECT ON JOB DURATION
4. A parametric approach to the estimation of cointegration vectors in panel data
5. MANAGEMENT PRACTICES ON VIRGINIA DAIRY FARMS
6. The name is absent
7. CREDIT SCORING, LOAN PRICING, AND FARM BUSINESS PERFORMANCE
8. Bird’s Eye View to Indonesian Mass Conflict Revisiting the Fact of Self-Organized Criticality
9. The use of formal education in Denmark 1980-1992
10. Macro-regional evaluation of the Structural Funds using the HERMIN modelling framework