Figure 2. Estimates of θt for city banks
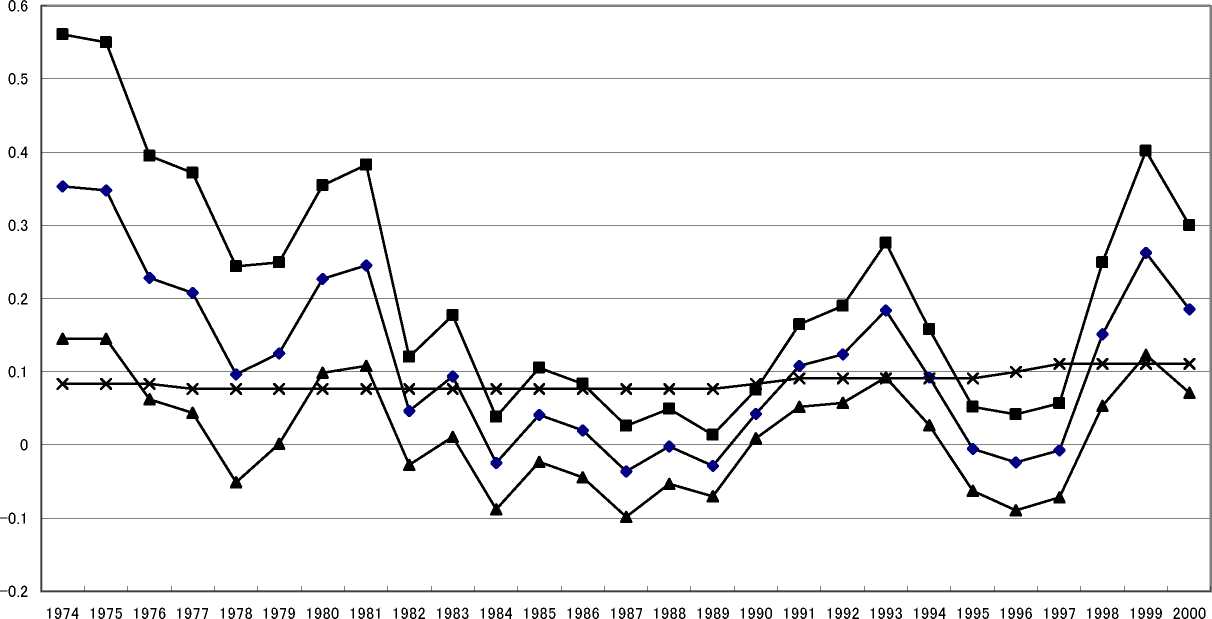
— — estimates
И 95% upper
—A—95% lower
—X—1/n
Note: MVR estimates of θt in Table 2 are shown with their 95% confidence interval. Line of 1/n corresponds to Cournot oligopoly, and line at zero
to perfect competition.
30
More intriguing information
1. Testing for One-Factor Models versus Stochastic Volatility Models2. The name is absent
3. The name is absent
4. ANTI-COMPETITIVE FINANCIAL CONTRACTING: THE DESIGN OF FINANCIAL CLAIMS.
5. Manufacturing Earnings and Cycles: New Evidence
6. The name is absent
7. Globalization, Redistribution, and the Composition of Public Education Expenditures
8. The name is absent
9. Indirect Effects of Pesticide Regulation and the Food Quality Protection Act
10. How we might be able to understand the brain