Figures and Tables
Tab. 1: Selection of store types and retailer companies in the sample
Retailer company
|
Total |
A |
B |
C |
D |
E |
F |
Other | |
|
SSM |
16 |
5 |
7 |
2 |
1 |
0 |
0 |
1 |
|
BSM |
43 |
12 |
5 |
11 |
3 |
4 |
0 |
8 |
|
CSM |
68 |
7 |
4 |
12 |
5 |
20 |
6 |
14 |
|
DC |
4 |
0 |
2 |
0 |
2 |
0 |
0 |
0 |
|
Total |
131 |
24 |
18 |
25 |
11 |
24 |
6 |
23 |
Notes: SSM: Small supermarkets, BSM: Big supermarkets, CSM: Combined supermarkets, DC: Discounter. A to
F: Different retailer companies, such as Edeka or Spar group.
Source: Data by ZMP, 2001.
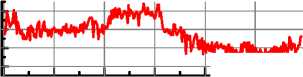
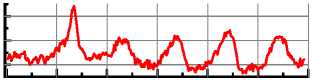
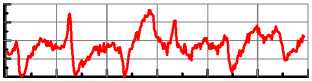
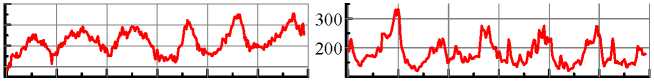
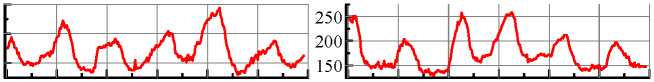
Fig. 1: Weekly average food retail prices in Germany from 1995 to 2000
beef
1600
1500
1400

pork
apples
0
1600
1400
1300
50 100 150 200 250 300
1400
1200

√⅛4

1600
1500
liver
sausage
ιl^uaftl
0 50 100 150 200 250 300
1700
1ЙЙЯРИ
1600
jl1500t
77^⅞⅛M7ττwιW⅝MMM
HMBMltok3≡πa

0 50 100 150 200 250 300 0 50 100 150 200 250 300
450
400
350
300
pears
0 50 100 150 200 250 300 0 50 100 150 200 250 300
citrons
65
60
55
50
lettuce
50 100 150 200 250 300 0 50 100 150 200 250 300
0
250
carrots
200
150
onions
0 50 100 150 200 250 300 0 50 100 150 200 250 300
poultry
Legend: All prices in German pennies per kg, except the prices of lettuce and citrons which are quoted in German
pennies per piece.
Source: Data by ZMP, 2001.
More intriguing information
1. Determinants of U.S. Textile and Apparel Import Trade2. Evaluating Consumer Usage of Nutritional Labeling: The Influence of Socio-Economic Characteristics
3. Government spending composition, technical change and wage inequality
4. Demographic Features, Beliefs And Socio-Psychological Impact Of Acne Vulgaris Among Its Sufferers In Two Towns In Nigeria
5. The name is absent
6. EXECUTIVE SUMMARY
7. The name is absent
8. Spatial Aggregation and Weather Risk Management
9. The name is absent
10. Commitment devices, opportunity windows, and institution building in Central Asia