tachment to the labour force than non-students,
in the population and, in Canada, the changes in
EI eligibility may also be loosening the attach-
ment of this age group to the labour force. The re-
lationship between the Canadian participation
and employment rates may, therefore, become
even closer in the future.
Primarily because of the higher school atten-
dance rate in 1997 than in 1989, a large part of
which appears to be permanent, an increase of no
more than three to four percentage points from
1996 to 2006 appears likely. The maintenance of
all the gains in the attendance rate would, by it-
self, preclude a return of the participation rate to
the peak level reached in 1989. Although the par-
ticipation rates for Canadian students and non-
students can be expected to continue to make cy-
clical gains, the gap between the participation and
the employment rates may shrink toward that of
the United States, in response to changed EI rules.
In contrast with this projection, the BLS is project-
ing a decline of 2.6 percentage points for this
group by 2006 in the United States (Fullerton,
1997: Table 4).
Older workers: Ages 55 and over
The most striking characteristics of participa-
tion rates for workers aged 55 and over in both
countries are the dramatic decline in the male rate
from the mid-1970s to the mid-1990s and the
close relationship between participation and em-
ployment rates, indicating a weak attachment to
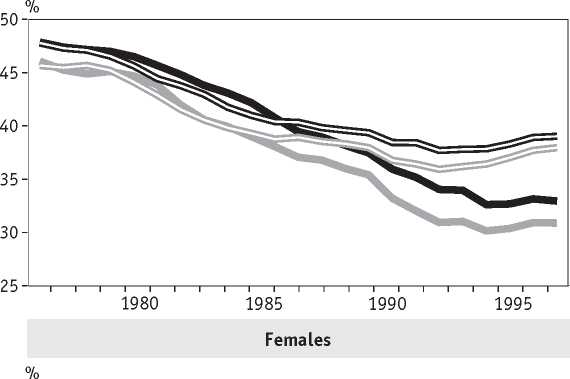
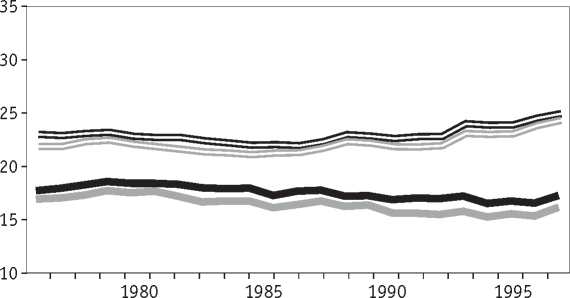
the labour force (Chart 11).29 Both the employ-
ment and participation rates for men in the two
countries ended their decline in the 1990s, and
have even risen slightly in the United States. Par-
ticipation rates for women, which are much lower
in Canada than in the United States, exhibited a
very weak downward trend until 1986. Since
then, these rates have diverged even more as the
U.S. rate ratcheted upward. The long-term nature
of the downward trend in this older group’s par-
ticipation rates suggests structural factors have
been more important than cyclical forces in their
labour market decisions. It is even difficult to find
a purely cyclical reason for the recent change in
the trend in the male rates.
There is a great deal of variation in participa-
tion rate patterns among the various age groups
that make up the aggregate 55 and over group. For
example, the rate for youngest sub-group of
women (aged 55-59) rose decisively in the 1980s.
Chart 11 Participation and employment rates,
55 and over
Males


Canadian participation rate Canadian employment rate
U.S. participation rate U.S. employment rate
Since the same group has been exhibiting compa-
rable behaviour in the United States, it appears
the ratcheting-up phenomenon of women’s par-
ticipation rates may be affecting this age group
and, may affect the 60-64 age group eventually.
In the United States, a new development ap-
pears to be taking place that may be a harbinger
for Canada. The change in direction in the partici-
pation rate for U.S. men aged 55 and over was
caused by an increase of more than two percent-
age points from 1986 to 1996 in the rate for the
65-75 age group.30 Since the rise continued
throughout the recession, when for most other
U.S. male groups it declined, it appears to be
structural. In Canada, the participation rate for
males aged 65-69 stopped falling in the 1990s,
suggesting it may follow the new trend for older
American men.
Summer 1999
Canadian Business Economics
11
More intriguing information
1. The name is absent2. The Impact of Financial Openness on Economic Integration: Evidence from the Europe and the Cis
3. The name is absent
4. Job quality and labour market performance
5. Micro-strategies of Contextualization Cross-national Transfer of Socially Responsible Investment
6. Can a Robot Hear Music? Can a Robot Dance? Can a Robot Tell What it Knows or Intends to Do? Can it Feel Pride or Shame in Company?
7. Dual Track Reforms: With and Without Losers
8. AN IMPROVED 2D OPTICAL FLOW SENSOR FOR MOTION SEGMENTATION
9. The name is absent
10. Manufacturing Earnings and Cycles: New Evidence